Pages

Thursday 28 January 2016

Happy Birthday, Peter Crouch.

It is nearly a year since I had the pleasure of helping Simon Gleave in putting together a presentation at the 2015 OptaProForum. The presentation looked at the ageing curve within the Premier League, so I thought I'd take advantage of the upcoming anniversary to reprise the theme.

But first.

Tuesday night saw the conclusion of a largely low quality league cup semi final between Stoke and Liverpool, won after extra time and penalty kicks by the Reds.

The tie, particularly the second leg was awash with narratives waiting to be seized upon by the commentators and pundits.

Corner kicks, we were told were Liverpool's weakness and Stoke's strength (circa 2010, maybe). Could the beleaguered Benteke redeem himself as a second half sub. Might Stoke's, Everton supporting Jon Walters score against their Merseyside rivals or Klopp march the Reds to new heights, despite barely shifting the statistical performance dial.

Once the game went to extra time and especially following Flanagan's red card substitution, penalty kicks became the focus of attention and it was left to Twitter to propagate the by now hoary old myth that the team shooting first wins 60% of the time.

Stoke had that privilege, promptly lost and all that was left was for Klopp to pronounce Liverpool deserved victors on the night. Rose tinted, rather than new designer specks.

One of the many possibly story lines did actually unfold. Peter Crouch ex Liverpool missed in the shootout for Stoke, although the media for once failed to demonise a player for failing with an opportunity that is missed around 20% of the time.

Crouch is nearing the end of a highly successful career. He will be 35 on Saturday, when Stoke take on Palace in the FA Cup. Save for a couple of formative seasons bouncing around the loan circuit from the Isthmian, to the Swedish and finally the English second tier, he has played exclusively in the Premier League for a variety of clubs.

Spurs, Liverpool, Villa, Southampton, Portsmouth and currently Stoke have all enjoyed the benefits of  6'7" Crouch being "much better on the ground than you give him credit for".

"The Windmill", Crouchie's short lived follow up to "The Robot".
The general ageing profile for out field Premier League players follows a path of gradual improvement through physical maturity and greater experience. Before the former leads to a decline in the physical side of the game that eventually cannot be compensated by an increase in the latter.

27 or 28 appears to be the stage when a player is at a peak and thereafter a decline in performance becomes likely.

A bell shaped plot, often using playing time as a proxy for performance neatly demonstrates the rise and fall of a players career path.

An alternative is to chart the changing output of a player from one season to the next. A young player will gain more playing time if he followed the hoped for progression, reaching a peak before an age related decline sees the opportunities given to him begin to decline.

This approach may not produce a clean plot if applied to the career of a single player. Long term injury may eliminate large portions of a season for one player compared to a much larger sample of like for like players. Or a player may fall out of favour, while remaining cushioned by a favourable contract.

In the case of Peter Crouch, the level and squad competition for places was likely more fierce at Liverpool and Spurs compared to Portsmouth and Southampton in their relegation year.

Therefore, if minutes played is used as a proxy for performance, the level of the club at which those minutes were earned should form part of the calculation.

2690 Premier League  minutes as a 31 year old in a Stoke team that earned 45 points has to be measured against 2141 minutes as a 24 year old in an 82 points Liverpool team.


In the plot above, I've created a performance indicator that combines minutes played and the quality of the team in which those minutes were won by the player. I've then plotted the change from season to season and although the plot is inevitably noisy, the trend line is typical of the gradually declining improvement until aged 28, followed by season on season decline until the mid 30's signal a possible need to consider options outside of the Premier League.

Crouchie's performance trend line neatly begins to turn negative around 28.

The noticeable dip in the individual plotted points at 25 is Crouch's final season at Liverpool under Benitez and in competition with Torres.

The January transfer window is perhaps not the best time to turn 35, an asset depreciating before your very eyes, but Crouchie will delight the Stoke fans if he scores the winner against Palace, if selected in the 4th round of the cup.

Sorry, Simon.

Tuesday 26 January 2016

Tottenham's Title Credentials.

Tottenham appear to be contenders for the Premier League title.

They're five points adrift of leaders Leicester, but just two behind Manchester City and Arsenal. So are ideally placed to benefit when some, if not all of the teams ahead of them drop points in a February fixture list that pits the Foxes against their two nearest rivals.

In terms of expected goals totals from attempts created and conceded, Tottenham has the most impressive expected goal difference so far this season. They are a couple of goals ahead of Manchester City and Arsenal, who are currently neck and neck and significantly ahead of Leicester.

Simulating the season to date based on goal attempts it is Tottenham rather than actual leaders Leicester who are most likely to top the table.

However, in reality the gap that exists between the top four needs to be bridged before Tottenham can claim the title. They may have legitimate claims to be the best team in the Premier League, but luck may have not smiled on them during the first 23 matches in comparison to their rivals, notably Leicester.

League points have already been won and even if they maintain their current superiority over their rivals they only have around a 17% chance of overhauling them and finishing the season in first place.

            Chances of Finishing in a Particular Position in 2015/16 Based on Expected Goals.


Arsenal enter the FA Cup break as the most likely winners of the Premier League by virtue of a slightly easier remaining schedule compared to Manchester City. City has also already played one more home match compared to the Gunners and any January squad strengthened should be allowed to play through in actual results rather than being second guessed.

Arsenal's position however is tenuous. A swing of just a point with City from their current positions would send the odds in favour of the Manchester side and it is currently odds on that someone other than Arsenal will be crowned champions in May.

To evaluate Spurs' season so far we have the goal attempt data for Tottenham and their opponents from their first 23 matches of the season and this may be used to estimate how frequently they might have expected to win each of their league matches to date.

For the opening match of the season the bookmaker's odds suggested that Tottenham had around a 16% chance of winning on their visit to Old Trafford and a 24% chance of a draw. In terms of expected points, Spurs would on average return with 0.72 points based on the odds maker's estimation.

In reality Tottenham created chances that had a cumulative expected goals value of 0.8 of a goal during the match compared to Manchester United's slightly better 0.95 of a goal.

If these rather low goal expectations are played out multiple times, spread over the individual chances created by each team, Spurs would win around 29% of the games, draw 33% and lose 38% and their average return would be 1.22 league points.

So even in a 1-0 defeat to begin the season, Spurs had over performed compared to the expectation of the market by creating and preventing chances that were consistent with them "winning" an average of 1.22 rather than 0.72 points.

    Spurs' Performance Based Against Market Expectations in their First 23 Games of 2015/16.


In only three Premier League games has the division of expected goals in Spurs' matches been consistent with a market under performance from Pochettino's team.

They got about what their below par performance deserved in draws with Stoke and WBA and would not have been flattered if they had won a point while faltering against Newcastle instead of suffering a last minute defeat.

Most frustratingly for Spurs, they did more than enough in their two games with leaders Leicester to have ordinarily won more than the single point they did gain.

Spurs, ready to kick start their title challenge? 
However, such fluctuations between expected and actual outcomes will occur in a season and Spurs, a side that is generally considered a regular top six team by the markets has consistently risen above those expectations in the majority of their games with solid underlying shooting data in 2015/16.

A similar performance in the remaining 15 games will make them credible title contenders.

@WillTGM and @cchappas have run similar analysis on not only Spurs in the following tweets. Just click on their twitter names for the links.

Friday 22 January 2016

Simulating a Single Game Using Expected Goals in Excel.

I've had a request to post a single game simulation using expected goals in excel.

I've chosen the Stoke v Spurs game in the penultimate week of the 2012/13 season, mainly because I took loads of photos at the match, which coincided with Stoke's 150 year celebrations.

Stoke had won just three of their previous 19 games, but two recent victories and a fixture list that threw up Wigan vs Villa on the last weekend, meant that relegation was no longer a threat. Spurs needed the win to keep their hopes alive of overtaking Arsenal for the final Champions League qualifying spot.

The game was played in a constant downpour. Stoke took an early lead through N'Zonzi, Spurs equalised soon after with Dempsey and following a rather predictable Adam red card just after the break, Spurs won the game in the final ten minutes.

Final score 1-2. It was Tony Pulis' final home game as Stoke manager.

Stoke had six goal attempts to Spurs' 25. For simplicity I've ignored related chances from the same attacking move.


The set up is as before. Column "A", the player taking the attempt, "B" his team, "C" the individual goal expectation for the attempt based on your model, "D" a randomly generated number (=rand()), "E" whether the attempt was successful or not.

If the random number is below the goal expectation for the chance, it's a goal. The formula to implement this is shown in the formula box above. Just copy it down for all 31 attempts in the 90 minutes.


Sum the "goals" scored by Stoke. It is the sum of the cells from E2 to E7. For Spurs it is the sum of the cells from E8 to E32.


Now we need to work out the result. Stoke's total goals in the game are in G2 and Spurs' in H2.

If Stoke win G2 must be greater than H2. If that is the case, the formula in I2 returns a "1". If not it returns "0".

For the draw returned in J2, the formula's altered to =IF(G2=H2,1,0). This returns a "1" for a draw or a "0" for a non-draw.

A Spurs win in K2 arises from =IF(H2>G2,1,0)


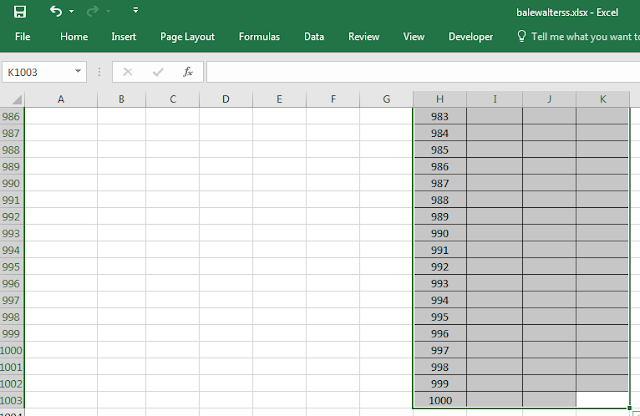
We're ready to run 1,000 sims of the game. As before drag the number of iterations from 1 to 1000. I've put that in column "H" starting in H4, below the Spurs score.

Then copy the match result into I4 to K4 for each of a Stoke win, a draw or a Spurs win. You put =I2 into cell I4, =J2 into J4 and =K2 into K4.


Again highlight the cells where we want the iterations to appear, in this case K1003 to H4.


Again click "Data" on the ribbon, followed by "What-If Analysis" and then "Data Table" on the drop down menu.


 Once again in the action box, click the cursor into the column input cell rather than the row input cell.


Then click in an empty cell. In this instance I've used $F$1003.

Now click "OK" and the results will fill the three column with Stoke wins and a fair few more Spurs victories. This may take a little longer than the previous two simulations for the individual players.


Once the results have fully populated you can sum for the number of Stoke "wins" based on the balance of their attempts compared to those of Spurs.

Should be a close game as long as the ref doesn't spoil it.
Because I've recorded wins/draws and losses simply by a 1 or a zero, if you take the average of i4;i1003 , j4:j1003 and k4:k1003 this will give you the proportion of iterations that resulted in either of the three possible outcomes.

In this case 8.6% Stoke wins, 18.6% draws and 72.8% Spurs wins.


Plotting the Results of Your Expected Goals Simulation.

Ok, you've run your simulation. If you haven't, check back to this previous post.

This time you've looked at the 49 non penalty goal attempts of Stoke's five goal Jonathan Walters from the same season as Bale's phenomenal 20+ goal season. We've generated results from 1,000 iterations of those 49 attempts.


We're likely to be interested in how many of the 1000 iterations resulted in an average Premier League player scoring a particular number of goals based on the model from which the goal expectations are derived. In column "I" I've counted up from zero and used the "countif" function to record how many times particular number of goals were scored in the 1,000 iterations.

The total goals scored in each simulation are totaled in the range G2 to G1,000 and that is the range we use in the countif function in the screen shot above. Add the $ signs to anchor the range when you paste down in column J.

The criteria for our countif function is the number of goals which we've put in column I. So I2 tells it to count how often zero goals were scored in the simulated seasons. There's no need to include the $ sign this time because we don't want the criteria to be fixed.


While the raw frequency of likely goals scored in the simulations does tell us something useful, a percentage of the whole is a more useful output.

Insert a column between the "Number of Goals" and "Frequency" columns and sum the number of iterations. It's in cell K19 and in this case is 1,000. Then divide the individual frequencies by this total number of trials. This is done in column "J". Again make $K$19 an absolute cell with the $ signs before copying down from J2.


The number can be expressed as a percentage by using the "%" from the "Home" tab. Additional decimal places can be added with the two buttons to the right of the "%" should you wish.


To add the graph, first highlight the range that contains the data. In this case it runs from K17 to J2. Click "Insert" on the ribbon and then "Recommended Charts".


A variety of choices will be suggested, but the histogram works best, so click to chose that option.

News Reaches Super Jon of Bale's Amazing Conversion Rate.


You can add labels in your own editing software of choice.

A slight probable under performance from Walters in 2012/13, scoring five non penalty goals from his 49 chances. However, it's around a 30% chance that an average Premier League players does as good or worse than Walters' actual record, so nothing too much to worry about given that Stoke weren't prolific chance creators.

It possibly explains why Real Madrid were in for Bale rather than Super Jon, though.

Running a Simple Simulation With Excel.

A post on how to run your own simulations in everyone's starter package, excel.

Requirement one. Your own expected goals estimates for each shot/header taken by the team/player and a full version of excel.


In column A you've got Bale, B has the expected goals for each non penalty attempt (he had 166 in his final Premier League season), C has a randomly generated number (=rand()) and D defines whether or not a goal was scored. You can see how it decides in the formula bar in the screen shot above. (=if(C2<B2,1,0)


 Sum the number of goals scored in this single iteration. It's in cell E167 and the formula is in the fx bar (=sum(D2:D167))


Copy the total goals scored in this one iteration into another cell to record the result. In this example I've placed it in H2. We're going to want to run lots of simulations, so in G2 I've started counting up from one, ending in G1001 with 1000. We're doing 1,000 runs in this example.


Now we want to run 1,000 iterations or more if you wish. So having copied G2 to G1001 from 1 to 1000, highlight cells H1001 to G2 by dragging the mouse from bottom right of the range to top left.


Next we need to click the "Data" tab on the ribbon and chose "What-If  Analysis" and finally "Data Table" on the drop down menu.


Once you've clicked on "Data Table" this action box will appear. By default the cursor is in the "Row input cell", but we need the "Column input cell". So click the cursor into this box.


Nearly there. Once you've got the cursor flashing in the column input cell, simply click on any cell without data. I've chosen B1001. Click "OK" in the "Data Table" box and the results of 1,000 simulations should with a bit of patience auto-fill into the cells from H3 to H1001.

To re run the 1,000 simulations, simply click on the "Formulas" on the ribbon, click "Calculations Options" and re check "Automatic" on the drop down menu.


It's then just a case of counting the frequency of each possible goal total, plotting a few graphs and posting an article.

Bale fails to add to his 2012/13 goal tally in his penultimate Premier League appearance.


Here's a chart of the frequency with which an average Premier League player would score a particular number of goals from Bale's 166 chances during 2012/13 just before his big money move to Spain. Bale scored over 20!

@SteMC74 has done sims using R here, but I can't find any post that just use excel.

Tuesday 19 January 2016

Weekly Projections for the Premier League's Mid Table.

Projections for the shuffling of the mid table pack over the last 16 weeks of the season.

Stoke slightly more likely to get into next season's Champions League than they are to be relegated. Although neither is particularly likely.

Figures are the chance of each position being occupied by the team after each particular week.

                                                    West Ham's Likely Position by Week.


                                                      Stoke's Likely Position by Week.


                                              Crystal Palace's Likely Position by Week.


                                               Southampton's Likely Position by Week.

                                           
                                                   Everton's Likely Position by Week.


                                                   Watford's Likely Position by Week.


The Where and When of the Title Race.

A journey is much more relaxing if you know the route you're likely to take. So with the Premier League now past the half way stage I thought I'd look not only at the range of possible finishing positions for the title aspirants, but also the likely highs and lows of their 16 game trip.

Teams have arrived at their current positions through a combination of talent and luck, either good or bad. The former should give a better prediction going forward, so I've used a shot based model to create team ratings and then simulated the remainder of the season over 10,000 iterations and plotted the league position, along with its likelihood of occurring at mainly 5 game intervals up to the end of the 38th game.

The range of points predicted to be won over the last 16 or whatever games are added to the actual points already won after 22 matches. It has been assumed that all games will take place as scheduled, although inevitably cup matches will disrupt the schedule.

Figures are the percentage chance of that position being attained in simulations.

                                               Arsenal's Likely Position by Week. 

    
Arsenal are title favourites at the moment based on my team ratings, but it is just slightly more likely that someone other than the Gunners will be crowned champions. A tricky trio of away trips eats into their chances of retaining their current top spot, before the fixture schedule relents just prior to their possibly season defining trip to the Etihad.

                                            Manchester City's Likely Position by Week.            


Second favourites for the title, City can likely put pressure on Arsenal until they face a tricky trip to Southampton immediately prior to their penultimate weekend hosting of Arsenal.

                                                Leicester's Likely Position by Week.


Leicester's green is trending downwards, but still remains within the top four and Champions League qualification. A finish outside the top four is more likely than the Foxes lifting the title, but a non title winning CL berth is odds on.

                                               Tottenham's Likely Position by Week.   


A hint of green edges upwards from Spurs' current fourth spot, but they remain the least likely of the current top four to lift the crown.

                                            Manchester United's Likely Position by Week.


United seemingly going nowhere with decreasing certainty.

                                                   Liverpool's Likely Position by Week.


Possibly onwards and upwards for Klopp's Liverpool, but probabilities fall away sharply and the important finishing spots of 4th or higher should be out of reach. Even more pessimistically, a not insignificant chance that they could finish outside the top ten.

The Elusiveness of Home Field Advantage.

A month ago I suggested that the widely supposed demise of home field advantage in the Premier League was overstated and the near equivalence of home and away wins in the first 17 match days wasn't widely different from a number of sequences of 170 matches seen in the recent past.

Home teams had also been unusually frequently charged with red cards compared to recent history.

Although I wasn't predicting an immediate switchback, home sides have fared extremely well in the ensuing month, winning 25 of the 40 matches. Overall for the season home teams now have won an unexceptional 40% of games compared to 31% for the visitors.

We may have simply witnessed simple variation within a relatively small sample of matches and the betting markets certainly continued to factor in a degree of home advantage. But a contributing factor in the rush to declare home advantage a thing of the past may have been the choice made to express the perceived effect.

Comparing the percentage of home wins against away victories or points per game for host and visitor appears a fairly uncontroversial selection. However, in extreme cases the choice may be a poor one.

If we consider two equally matched teams playing a season's worth of games against each other where home field advantage is a typical 4 tenths of a goal. In this case the effect of home field advantage is well illustrated by taking the percentage of home wins (on average 46% in 10,000 sims) and compared it to away wins (~26%).

Home teams also score an average of 0.4 goals more than away teams.

Still No Place Like Home.
If however, we make one side greatly superior to the other and simulate a season again with a home field advantage baked into the simulation, it becomes much less obvious that a home field advantage exists by simply looking at win percentages for the home and away teams.

When we change the competitive balance of the matches between two teams to mimic the type of extremes we might see between the best and worst in the Premier League "home field advantage" as measured by win% nearly "vanishes".

Home teams win only a few % of games more than away teams achieve.

The much better team in this artificial simulation wins a high proportion of home games and a similarly high proportion of away matches bringing the home and away win % close together.

It is only when we look at goal differential do we see that the home teams are scoring on average nearly half a goal a game more than the away team over the simulated season, despite a near equivalence of home and away wins.

These are extremes, but if a batch of games bears a greater resemblance to the second simulated scenario than to the first and respective home and away win percentages are quoted rather than say goal difference between host and visitor, we may erroneously conclude that home field advantage has disappeared. When it has merely chosen not revealed itself by a measure that may be sensitive to the competitive balance of the sample of games played.

Saturday 16 January 2016

Stoke, Four Seasons in One Day.

So far this season Stoke have been variously described as relegation candidates (six points from the first seven matches), mid table fodder (19 from 14 games), potential Champions League qualifiers (32 from 21) and as a side that raises their level of performance against top teams, but loses against lesser lights.

Each description has to a degree been legitimized by data driven evidence, usually based around the team's current record or in the case of the latter, cherry picked evidence based on a relatively small sample of matches.

Gaining less than a point a game, as they did in the first seven matches is relegation form in a normal season, but then Stoke won nearly two points per game in their next seven contests.

Champions League form combined with relegation form to leave them safely in mid table.

Similarly, the new found, but almost certainly transient reputation as scourge of the best owes much to two high profile televised victories against the two Manchester clubs. The red side of which has also lost to Bournemouth and Swansea.

Encompassing the traditional big five of Chelsea, Liverpool, Arsenal and the two Manchester clubs and including cup ties, Stoke has a success rate during 2015/16 of 50%. If the actual top five is used the success rate remains the same.

Stoke, Probably Still Mid Table and Looking Upwards.
Should Stoke defeat Arsenal on Sunday, the latter success rate could rise to nearly 60%, but defeat may see it fall to just above 40%, providing useful numerical evidence for whichever narrative you wish to push. But perhaps more indicative of the tendency for rates derived from small data sample to bounce around with the addition of a single result.

Following Stoke's win over Norwich, their success rate against the current bottom seven sides rose to 75% or just 60% if you care to include 8th from bottom WBA, against whom the Potters have played with 17 rather than 20 outfielders for a large part of their two encounters.

In short, "solid" trends and soundbite labels can quickly become nothing more than noise going forward.

Small samples should not move the needle much. A side may record results typical of a bottom three team or a top four contender for a small run of games, without either being indicative of a sea change.

How Stoke's Win% May Have Changed with Prior Knowledge of their 2015/16 Performances.


In the table above, I've included the probability that Stoke won each of their games this season as judged by the bookmaking markets.

I've then recalculated the win odds for Stoke based on the accumulated shot data of the Potters and each team they have played over the entire 2015/16 season to date to see if there is a substantial difference between the two sets of estimates.

In twelve cases Stoke has a higher chance of winning based on the January ratings of all 20 teams compare to the odds quoted on the day. Nine matches give their opponents an additional edge compared to actual match day odds.

So as Stoke's perceived quality has shifted over the season, so has that of the remainder of the Premier League. Some teams, notably Chelsea, Villa and Newcastle have become poorer relative to the market estimation of their abilities when they played Stoke and some, Watford, Leicester and WBA have shown relative improvement.

This shuffling of the performance pack has left Stoke worse off than generally expected with Leicester compared to the prevailing wisdom when they met in mi September, but possibly better off with Chelsea.

Overall they have a net tally that leaves them in a similar mid table standing to previous recent seasons, regardless of niche televised heroics and failure to beat the new, long ball version of WBA.

Thursday 14 January 2016

How Many Points Might the Premier League Champions Gain?

One of the difficulties with seasonal sporting projections is that they are often presented in terms of the average expected outcome.

In the NFL it is rare to see projected win totals for the regular season that are in excess of around 10 wins for the 16 games season, even for the very best contenders. Yet in reality a handful of sides almost always achieve more than 10 wins. This season Carolina won 15 of heir 16 games.

A side may win nearly all of their regular season matches through a combination of skill and luck. However, projections cannot really help when trying to predict which team will see their returns buoyed by the addition of a few lucky victories.

As Simon Gleave has pointed out, the same conundrum exists in simulating the outcomes of the remainder of the Premier League. Most models appear to agree that the winner of the 2015/16 title is most likely to have gained around 80 points.

Prior to Wednesday night's games the top four teams, Arsenal, Manchester City, Leicester and Tottenham were expected to respectively win an average of 81, 76, 74 and 74 points in simulations using team ranking derived from shot models.

However, averages tell little about the range and likelihood of points that may be won by any of the main challengers in this season's title race.


By simulating the remaining matches based on team ratings and the number of actual points won to date we may get a more informative picture of how the title race may evolve.

There appears to be a not insignificant 14% likelihood that the title will be won with between 74 and 78 points and a similar chance that one of the championship winning teams will gain 86 or more points to lift the title.

The combination of current team strength, number of points already won, but also spending during January and fortune with injuries, refereeing decisions and a multitude of other variables will decided the ultimate "who" and "how many" of the 2015/16 title race.

Tuesday 12 January 2016

Manager of the Month. Do You Really Want to Win It?

The cup competitions usually provide the only realistic routes for minor Premiership teams and their managers to win any tangible trophies and gain recognition for their talents and endeavours.

The prolonged 38 game marathon that is a Premiership season may be short enough for an occasional dark horse to slip into a top five finish, but as the financial gap between the elite and the rest remains, it is highly unlikely that all of the top sides will finish below an unexpectedly lucky mid table team. Although Leicester are currently stress testing this to the limit.

Even the FA Cup has increasingly been dominated by the big four, so only the league cup, in its many guises remains as a viable target for mid table Premiership teams. 

However, the manager of the month award also provides a minor, if achievable victory for any Premiership side, no matter how small.

The format is heavily tipped to favour an upset. It comprises just a handful of games, with a new competition beginning regularly, against often heavily skewed strengths of schedule. The vagaries of luck can see teams produce results that would be unlikely to be repeated over the longer stretch of 38 matches, when talent increasingly overpowers good fortune.

Since January 2000, nearly half of the monthly awards have fallen to the manager of either Manchester clubs, Arsenal, Chelsea or Liverpool. By contrast these clubs between themselves have won each and every Premiership title. 

So their dominance on a year to year basis isn’t repeated over a monthly cycle.

51 different managers and 30 separate teams have been crowned the month’s best performer in the 142 individual competitions since New Year’s Day 2000. 

Owen Coyle, Phil Brown, Brian McDermott and Garry Monk have been feted alongside more usual recipients, such as Sir Alex Ferguson and Arsene Wenger. Reading’s McDermott even winning a monthly award in the season that his side was relegated and just 33 days before his sacking.

The relative democracy that small numbers of matches can bring to the Premiership was neatly demonstrated by the last two recipients of the award during the 2013/14 season.

Brendan Rodgers lifted the award in March 2014 as Liverpool fought for the title and Tony Pulis won in April, as Crystal Palace escaped from the relegation zone. The two sides then met in May and the underdogs Palace fatally undermined high flying Liverpool’s title challenge in a single, unpredictable match.

So small sample size can temporarily elevate inferior sides above their more illustrious rivals and while gaining more points that your rivals in a calendar month doesn’t always guarantee the manager of the month award, it is obviously a huge contributing factor.

The first two months of the current season rewarded South American managers, Pellegrini and Pochettino winning awards for their results at Manchester City and Spurs respectively. 

The former was a clear winner in August. Simulations from shot models for all 40 matches resulted in City topping the table on points and if necessary goal difference over half the time, with their nearest virtual challengers, Arsenal, Manchester United and Swansea trailing well behind.

September was less clear cut. Shot models project Spurs as the most likely side with the best September Premier League record, but Southampton and Everton run them close.

The volatility of a small number of matches is evident in Everton's first two months of the campaign. Hugely unlikely to have topped the table in August they chased home Spurs and Southampton during the following month. Similarly, runaway winners in August, Manchester City fared only slightly better in simulations than did Newcastle in September.

Such a run at the beginning of the season is obviously most evident because it will be mirrored in the current league position of a side and it is easy to make unmerited assumptions without realising how likely this is to happen just by natural variation within a small number of games.

The sight of a manager of any team lifting a manager of the month award may elevate expectations. When this new "norm" fails to be repeated, as it may well do if luck is a component, disappointment, as Brian McDermott discovered at Reading may quickly follow.