I was reminded in Mark Thompson and Ashwin Raman's recent glossary of football analytics that I wrote one of the first posts about the effect of game state on the way each side approaches the game in relation to goal attempts and how they are able to convert these chances.
You can read my 2012 post here & the aforementioned duo's glossary here
Six years down the line and we don't seem to have, publically at least, moved on much from the less than startling conclusion that trailing teams tend to make a greater effort to score by shooting more often, if a little more desperately.
I feel much of the problem is down to a lack of framework to adequately describe game state.
I've posted occasional alternatives to simply using basic score differential over time. The approach I've found most useful involves quantifying the way each team's pre game expectation has decayed as time elapses and the score alters.
This is most pertinent in a tied game. If you're the pregame favourite, a level score line isn't that surprising after 10 minutes, but might be positively disappointing with just ten minutes remaining.
In the former match position, the expected number of league points you might win hasn't moved that far from the initial estimate at kick-off, whereas it has (for the worse) in the latter.
So that's likely to impact on the balance of risk/reward for both teams.
Building such a variable that quantifies this change in pre game expectation as an alternative to using just the raw score line to define game state is a tedious, but fairly basic chore. (Which I've finally gotten around to doing).
Change in expectation is, imo much superior to score line because it mimics the nuance of a match situation much better than using simply goals because it incorporates many factors that are missing when you just focus entirely on who's beating who (or not).
Notably, the time remaining is accounted for.
When I first wrote about game state, but for the generosity of Opta, there was very little granular data around. But now shot location etc is available and the mainstay of every xG model on the market.
I therefore, built two different xG models that use all the usual features and also a term for game state.
One used simply score differential to designate game state (although I'd much prefer that this metric was referred to as score differential.....because....that's....what.....it.....is) and a second incorporated the change in pregame expectation in its place.
I then repeatedly tested these two models on out of sample, regular play goal attempts to see which model performed best.
There are numerous ways to test out of sample prediction, but I chose to group the predictions and outcomes into ascending groups and then quantify how likely it was that the averaged predicted and actual outcome from each group originated from the same distribution.
In repeated trials, around 70% of the time the "change in pregame expectation" approach to game state performed better that just using the score.
One of the main reasons for the improved performance is how tied games are described.
In a typical Premier League season, 75% of the shots taken in a tied game were taken by the side whose current situation, in terms of expected league points won at the end of the match, had declined compared to kickoff.
Sunday, 30 December 2018
Friday, 28 December 2018
The Benefits of Being Subbed On.
I first posted about the advantages enjoyed by a sub 20+ years ago on something called usenet, before it got swamped in an avalanche of spam and became unusable.
I've added a few blogs here as well. Here's on centred around Edin Dzeko
The basic concept is very straightforward.
Goal scoring rates gradually increases as the match progresses, so if you're always getting subbed on in the 70 minute, you're playing in a very different scoring environment compared to someone who starts the match.
You've also been lounging around for an hour or so, while everyone else has been running their socks off.
That's not entirely the whole story. Game state and team talent differential also has a say.
A much better team won't be cranking up the attacking process quite as much in the first half of a tied match, compared to the final twenty minutes, if the score line status quo has been maintained.
Changing game states in tied games with a large talent differential between the teams are biggish deals, both of which we'll ignore in this post.
Working out a rough and ready goal environment for players based on when they were on the field is a fairly trivial task.
All you need is a decay factor, an initial expected scoring rate and a spreadsheet and you can easily calculate the goal expectancy (not to be confused with expected goals) for any minute in a match.
For an average team, the goal expectancy during the 80th minute is around 33% bigger than the equivalent during the 10th minute. So the frantic last ten minutes is very different to the languid first ten.
I finally got around to working out a way to quantify the "subs premium" when Shaq's offensive production for Liverpool started popping up on Twitter over Christmas.
I though, (wrongly as it mostly turned out), that his stats had been padded by playing most of his minutes late on in games as a sub.
His numbers have definitely benefitted from small sample extremes, (which may or may not be maintained), but that's another issue entirely.
He's made 14 appearances for Liverpool in the Premier League, six from the bench. Depending upon how you treat added time, that's around 760 minutes of playing time.
To see by how much Shaq's benefitted from playing when the goal environment has been cranked up, we just need to take a baseline figure for a side's goal expectancy over a full game.
Then work out the goal expectancy for each individual minute.
Add up the relevant goal expectancies tied to each minute Shaq has played.
Compare this to his theoretical goal expectancy he would have if every minute he played was equally spread across the 90+ minutes of a game.
Bottom line, Shaq's 760 minutes, equally spread over a match, based on him playing for the average Premier League team he used to grace, equates to a goal expectancy of 10.39 goals.
This compares to 10.59 goals based on the actual identity of every actual minute he's been on the field for.
His split of sub and starting appearances has benefitted him by around a 2% increase in goal scoring environment compared to par.
His numbers aren't particularly boosted by him having disproportionately large opportunities to feast on the weary, late in games.
Good buy.
I've added a few blogs here as well. Here's on centred around Edin Dzeko
The basic concept is very straightforward.
Goal scoring rates gradually increases as the match progresses, so if you're always getting subbed on in the 70 minute, you're playing in a very different scoring environment compared to someone who starts the match.
You've also been lounging around for an hour or so, while everyone else has been running their socks off.
That's not entirely the whole story. Game state and team talent differential also has a say.
A much better team won't be cranking up the attacking process quite as much in the first half of a tied match, compared to the final twenty minutes, if the score line status quo has been maintained.
Changing game states in tied games with a large talent differential between the teams are biggish deals, both of which we'll ignore in this post.
Working out a rough and ready goal environment for players based on when they were on the field is a fairly trivial task.
All you need is a decay factor, an initial expected scoring rate and a spreadsheet and you can easily calculate the goal expectancy (not to be confused with expected goals) for any minute in a match.
For an average team, the goal expectancy during the 80th minute is around 33% bigger than the equivalent during the 10th minute. So the frantic last ten minutes is very different to the languid first ten.
 |
Shaq.....Once a Red & White, always a Red......
|
I though, (wrongly as it mostly turned out), that his stats had been padded by playing most of his minutes late on in games as a sub.
His numbers have definitely benefitted from small sample extremes, (which may or may not be maintained), but that's another issue entirely.
He's made 14 appearances for Liverpool in the Premier League, six from the bench. Depending upon how you treat added time, that's around 760 minutes of playing time.
To see by how much Shaq's benefitted from playing when the goal environment has been cranked up, we just need to take a baseline figure for a side's goal expectancy over a full game.
Then work out the goal expectancy for each individual minute.
Add up the relevant goal expectancies tied to each minute Shaq has played.
Compare this to his theoretical goal expectancy he would have if every minute he played was equally spread across the 90+ minutes of a game.
Bottom line, Shaq's 760 minutes, equally spread over a match, based on him playing for the average Premier League team he used to grace, equates to a goal expectancy of 10.39 goals.
This compares to 10.59 goals based on the actual identity of every actual minute he's been on the field for.
His split of sub and starting appearances has benefitted him by around a 2% increase in goal scoring environment compared to par.
His numbers aren't particularly boosted by him having disproportionately large opportunities to feast on the weary, late in games.
Good buy.
Wednesday, 21 November 2018
Non Shot Expected Goals Plus/Minus.
I last wrote about football's major problems when attempting to replicate the so called plus/minus stat from other, mainly US based sports here
In truth I only wrote it to work a spurious photo of Harry Nilsson into a football blog, but the objections raised were valid.
The main hurdle is the lack of goals, not a problem in sports where +/- exist (in mainly forms) such as basketball.
Five years on we may have a partial solution to lack of goals.
Goal attempts, expressed in shot based xG does improve the performance related sample size, but non shot expected goals models, applied to either individual actions or possessions, opens up a much richer source of data.
The problems of comparing changing lineups, the duration they are in opposition, the non shot xG differential and the venue, are purely technical and mathematical, as well as being difficult to compute on an industrial scale.
But non shot xG may have removed the final obstacle to creating credible +/- numbers for football, for which every defender and defensive midfielder should be hugely grateful.
If and when I finally data dump everything into a huge matrix & run off some figures, they'll appear here.
Tuesday, 13 November 2018
Events per Possession.
Different models have different basic events that define them.
Shot based expected goals models have all goal attempts as their baseline unit.
XG2 models to rate keepers have attempts on target.
And non shot xG models are framed around possessions.
For the latter we'd like to know more about an individual possession. we can measure the speed, (see previous primer), but we'd also like to know what's happening during a possession.
Usually that's passes and runs with the ball that are designed to probe defenses and create space.
We therefore look at how many significant events occur per possession.
If there's lots of passes and lots of runs, you might be chasing shadows.
If there's just mainly passing, you're probably better able to keep a good defensive shape.
Speed of Attacks
Measuring speed is easy, it's just distance travelled/time. Right?
But that's not really the correct approach to take on a football pitch.
Making 30 yards running from deep in 5 seconds probably isn't the equivalent of making the same, but with the halfway line as the starting point.
In Non Shot expected goals terms you're going from a very small threat to a slightly greater threat in scenario one and from a moderate threat to a really dangerous threat in the second case.
So instead of using distance made/time to measure the speed of an attack, we measure Non shot xG gained/time to define the speed of an attack in football.
It even comes out as a sensible double digit number if you convert it to NSxG per hour!
Saturday, 10 November 2018
Non Shot Passing Ratings
Most people now accept that passing percentage is a
useless stat and it was natural to look at the difficulty of the pass attempted
and compare actual success rate to the expected one.
However,
this approach still has drawbacks.
Passing is
a risk/reward action.
A player
risks the value of the field position from where he makes the pass for the
reward of completing the pass against the loss of handing possession to the
opposition.
We can
measure field position in non-shot terms, (broadly, the likelihood that a goal
results from possession at a point on the field).
This rather
important aspect of a pass should be included in any assessment of passing
ability.
(Consider
this contrived example. Player A
attempts a relatively difficult pass.
Let’s say it’s completed on average 70%
of the time.
It’s deep in his own half, so it isn’t
particularly valuable to his side. We’ll say the pass is “worth” 0.02 NS xG.
If it is picked off, the opposition get
healthy field position worth 0.1 NS xG.
On average, an average player therefore
gains a cumulative 0.14 NS xG on the 7 out of ten occasions that the pass is successful…and
loses 0.3 NS xG on the three times it isn’t.
This is long term, a potentially very poor
choice of pass for an average player.
Now if a very good passing player
completes the pass eight times out of ten, rather than just seven, he’s going
to appear to be well above average on a model based just on pass completion
& difficulty of the pass.
However, the choice of pass is still poor, long term. Now he gains 0.16
NS xG for his eight completions and still loses 0.2 NS xG for the two
failures).
We should when looking at passes
examine the player’s choice of risk/reward of the pass, the difficulty of the
pass and compare those factors to the actual outcome.
Here’s 2018/19 so far for attacking players

Nearly 99% of Sane’s passes had a positive
expectation, 95.5% of Ozil’s. Perhaps Ozil is being a bit more adventurous?
When we examine the outcome of all Ozil’s
2018/19 attempts, he’s gained 2.43 NS xG per 100 passes attempted.
Sterling tops that particular column
with 3 NS xG per 100.
If we’d put Ozil’s attempted passes at
the feet of our average model, the gain would have been only 2.17 NS xG per
100.
Arsenal’s player maker has overperformed
by 12%.
By comparison, Moura has underperformed
his expectation from his choice of passes by nearly 16%.
Another Brazilian who you would
anticipate progressing as he reaches his prime is Richarlison. Nearly 8% of his
passes currently have a negative expectation, but he’s still got a pass
expectation of 2.4 NSxG per 100.
His actual is only 1.8 NSxG per 100.
That leaves plenty of room for his choices to perhaps improve slightly and his
execution to at least approach the average for a Premier League passer. So
decent, if below average passing production, but loads of upside.
All the data is from Infogol
Friday, 21 September 2018
A Brief History of Non-Shot xG Models.
There’s lots of new metrics turning up from non-shot
models.
Normal xG is relatively straightforward.
The variables
used may differ between models, but there is a core similarity based around
shot type and location.
But as more and more “NSxG” models appear it is
becoming apparent that one person’s NSxG model can be a completely different
beast to someone else’s.
Here’s my broad definitions of what I mean when I use
these terms based around the models we have developed at Infogol.
1) Non- Shot xG
As the name suggests, shots, or more generally
attempts at goal, do not hold a position of importance in a NSxG model.
They are simply another data point.
Possession, rather than goal attempts are central to
this approach and the outcome variable is whether a goal was scored.
Possession of the ball deep in your own territory will
have a relatively small NSxG value because many more such possessions will end
with possession being turned over than a goal being scored.
Possession closer to the opponent’s goal is more
likely to result in a goal and therefore will have a higher generic NSxG.
The pitch will be defined by a NSxG framework whereby every
position on the field will have a NSxG value for the team in possession and the
team attempting to take possession.
This is partly analogous to a normal xG probability
map, but it is unlikely that the NSxG value will be the same as the xG value
for the same position on the pitch.
2) Change in NSxG
Hopefully self-explanatory. The difference (positive
or negative) in NSxG terms between one position on the field and another.
3) A team’s NSxG value for a match.
Both NSxG and xG are attempting to describe the
process a side has achieved in attempting to produce a favourable outcome.
Namely scoring more goals than they concede.
Both are expressed in expected goals, although one
method (xG) looks at a limited subset of events that occurred in the match
(goal attempts) and the other (NSxG) looks at every event that occurred,
accumulated into separate possession chains.
They are entirely different models, albeit with the same ultimate aim of describing the events of a football match.
NSxG and (shot based) xG values should be broadly similar when summed
together for a single game, although the NSxG contains much more granular
information than a xG model and so small variations should be expected (and
even hoped for).
The measured unit in xG is the expected goals value at
the point of the goal attempt.
The measured unit in NSxG is the expected goals value
at the initiation of each possession.
4) NSxG risk / reward.
When a player attempts to move the ball from one field
position to another, there exists the combined reward of keeping possession and
improving or reducing the NSxG value of the possession at the point in the
individual possession chain.
If we include the likelihood that the action will be
successful based on either an average passing or ball progression model, we can
determine if the action will have a positive or negative expectation from the
view point of an average team.
We can further see if certain teams are taking more
risky, negative expectation passes or actions, but because they have a
repeatable over-performance in completing these actions they are turning
negative expectation moves into positive expectation ones.
This ultimately adds context to possession data.
5) NSxG Timelines.
Using cumulative accumulation of shot based xG for each
side as the match progresses has it’s uses, but also critics.
Shots at goal account for less than 2% of game
events, whereas many dangerous moves may stall just before an attempt is made.
Therefore, a NSxG approach that incorporates every
possession may reveal more about how the match played out.
Simulations, while not immune to score effects, add
another layer of information, indicating how likely it is that the match is
either currently level or being led by one of the teams.
If we use goal attempts and their xG to simulate these
likely states, we often only have around 30 simulation points.
By using NSxG we can increase not only the wealth of
match data that is included, but also increase the simulation points by looking
at every possession, rather than just every goal attempt.
6) Player Ratings
Shot based xG major’s on attacking players and
playmakers.
NSxG incorporates the small, but often, gains made by
players further down the supply chain and can also be used to show how a side's effectiveness changes if an efficient ball circulator (who may not accrue much positive NSxG) is absent.
This allows a gateway into isolating the on-ball
contribution made by all players to creating or preventing goals being scored.
7) Example
12th August 2017
xG Brighton 0.67
Manchester City 2.24
NSxG for all possessions, including ones leading to
own goals.
NSxG Brighton 0.79 Manchester City 1.97
Timeline.
A dominant performance from Manchester City
to open their title winning 2017/18 season. Only a 13% they lose the game based
on possession chains.

Kevin De Bruyne most influential player in the match.
Monday, 14 May 2018
Non-Shot xG Passing Stats. The Complete Picture.
The 2017/18 Premier League season is now a wrap and you’ll
be bombarded with end of season advanced stats, both team based and for
individuals.
Mostly, these figures will largely confirm what we
intuitively know.
Kevin De Bruyne may not have come close to Mo Salah’s goal
output, both actual and expected, but he contributed massively to Manchester
City’s creative avalanche with outrageous passing ability.
The gradual advent of pass based, non-shot expected goals
models is beginning to highlight the contribution of those creative players who
often provide the raw material for the scorers to bask in the celebratory
spotlight.
However, many of these interpretations have exclusively
concentrated on the positive contributions made by attempting to advance the
ball, while ignoring the cost when a player’s misplaced pass leads to a
turnover.
Possession comes with responsibility as well as opportunity
and while a completed pass rightly causes an uptick in expected goals fortunes
for a side and a player, there is always a price to pay if the ball instead
ends up at the feet of the opposition.
Infogol’s non-shot passing model gives an expected goals
figure to every possible possession location on the field of play, but it will
be different from the perspective of the two teams.
Possession on the edge of your own box will be worth very
little in terms of non-shot expected goals, but would be hugely valuable if
possession switched to your opponents.
So a misplaced pass that turns over possession deep in your
own half will lose your side the tiny expected goals valuation that went along
with that possession, but will also hand a much larger chunk of NS xG to your
rivals.
The cost of losing that possession would be significant.
Similarly, lose possession deep in your opponents half and
you are conceding the hard won NS xG owned by progressing deep into opposition
territory and you’ll also hand a small amount of NS xG associated with
opposition possession in their own half.
Just as we can tally the positive contributions made by
players, we can also see what their misplaced passes cost their side.
It is inevitable that KDB will lose possession for his side
in valuable areas, it is the natural cost of the high tariff passes he often
attempts, but ignoring these entries in the debit side of the creative ledger
omits the realistic representation of football as experienced by those who watch
the full 90 minutes rather than just the highlight reel.
To give a flavour of the much more rounded picture NS model
can convey, here’s a breakdown of the percentage of team passing creativity
owned by players from the 2017/18 season, but also balanced by the percentage
of team NS xG lost by misplaced passes that belong to the individual.
Top 10 Defenders.

Bottom 10 Defenders

Top 10 Midfielders

Bottom 10 Midfielders

Top 10 Strikers (+ Wayne).

Bottom 10 Strikers

Here’s the top and bottom 10 list of players that compares
the amount of good things their passes have contributed against the times when
their passing radar has gone astray.
They’ve been sorted by position, because the opportunity to
create or make mistakes is largely driven by where you play. I’ve also compared
the player’s importance to his side.
For example, Aaron Cresswell’s passes has contributed 17.5%
of West Ham’s total positive change in non-shot xG and he has been responsible
for 10.5% of the NS xG the Hammers have lost due to misplaced passes.
At the other end of the scale, Benteke’s passes has
contributed 2.7% of Palace’s positive NS xG from passing, but he’s given away
10.3% of his side’s total generosity to their opponents.
I’ve included Rooney as a striker just to give him a
suitable Premier League send off.
Wednesday, 2 May 2018
Non-Shot xG Models
This blog's been rather quite of late, mainly due to my writing over at Pinnacle, alongside working since 2016 as the Football Product Manager at Timeform, a analytics, content & data company.
So while the bulk of my output appears on these two sites, TPoG does give me the chance to prime some of the new stuff we've developed.
This week on the Infogol site, we revealed the work we've been doing to develop a non-shot xG model. The post can be read HERE
NSxG isn't a new concept, the idea's been around in other sports, such as the NFL for decades, but the fluid nature of football/soccer has made such models very data hungry & time consuming to run on a humble works computer.
I'll use this post to throw in some random thoughts about our NS xG and highlight the advantages and similarities to the more readily seen chance based xG models.
What's NS xG?
NSxG gives a value to every possession in every area of the playing field. It's most usefully expressed in expected goals and describes the likelihood that a possession will eventually turn into a goal.
If you've got the ball deep in your own half, the chance of that possession developing into a goal is tiny. If you've the ball in your opponent's penalty area, it's a lot more.
How can NSxG be Used?
In much the same way as shot based xG. namely to evaluate players and teams, but in the former case it's much more inclusive.
If you successfully move the ball from your own box to the opponents with one raking pass, you'll personally (along with the receiver) get the credit for the improvement in NSxG associated with the pass.
More realistically, if you competently move the ball ten yards upfield, you'll get a small uptick in NSxG. Do it consistently and you might even be ranked as the best at beginning deep lying moves in the Premier League.
What About Mistakes ?
There's risk and reward with every pass attempt. Unintentionally pass to the opposition instead of your deep lying playmaker and you're handing the opponents a fairly big chunk of NSxG, while giving up the small amount you owned prior to the pass.
So it can be used to Evaluate Defensive Actions?
Yes, break up an attack with a tackle or interception and you can cost out the benefit by just summing the pre and post event NSxG for both teams.
What About Backward Passes that Find a Team Mate?
They'll lose NSxG, for the player making the pass, but they can be classified separately and might reveal the required role of the player or the tactical mode a side has slipped into, perhaps when defending a lead.
It's a harsh system that penalizes a player for taking the kick off.
Can It Only Be Used for Passes?
No, it can be applied to any recorded action, running with the ball burns calories and gradually ticks up the change in NSxG (provided you're running in the right direction).
Who Benefits from an NSxG Model.
Players who don't regularly provide a key pass or get onto the end of lots of chances. If you're the one breaking up the opposition's midfield passing or tasked with circulating the ball you've been bypassed by attacking event based expected goals.
NSxG shows everyone what you do
Can You Show That Players or Teams Over or Under Perform a NSxG Model?
Easily. Build your baseline model around the entire Premier League and you can estimate not only the worth of advancing the ball from A to B, but also how often an average Premier League side would expect to successfully achieve the pass or run.
Then you just see how often a particular team/player fares compared to the league average.
Is it Better than Normal xG?
Not really better, just different. Usual xG does really well at rating teams, but less well at picking out individual contribution or mistakes.
If you've help craft a sublime move that goes the length of the pitch only for a team mate to fall over his or her own feet and lose the ball, you'd like some credit (& perhaps a black mark against your clumsy colleague, especially if he or she makes a habit of it).
Any Examples?
Here's the Liverpool 4 Manchester City 3 game from January broken down by the pass related NSxG for all the players.

There's a lot of numbers, so it's colour coded, blue is good, red is not so, although the jury is still out on the final column.
First numerical column is the cumulative increase in NSxG by each player's successful passes.
The Ox, Firmino and Mane showing up well. Gomez perhaps a surprise being so prominent? (I don't watch much Liverpool). Mo would show up more, I assume if we included the pass receiver as well, rather than just the passer.
De Bruyne unsurprisingly topping City's numbers, with Otamendi stepping up to help with the game chasing.
Next column is the NSxG "lost" by successful backward passes. Just ball re-circulation really.
Third column is the cumulative net gain through disrupting the opposition's passes. The Ox was definitely up for it that day.
Last column's a bit of a conundrum. It's NSxG lost by a player through misplaced or broken up passes.
You have to ask do you want to penalise your most talented players who try the most difficult passes, such as De Bruyne and the Ox (again).
If you don't have the red in column four, you may not have the blue in column one. Although they might ultimately harm the team by their extravagant pass choices.
It's all risk/reward and passing with purpose.
Here's a week later at the Liberty.
Liverpool losing 1-0 to Swansea.

30/70 possession in favour of Liverpool.
Liverpool's defenders stepping up to kick start many of their attacks. Lots of Liverpool passes going astray, but not particularly because of direct Swansea intervention. Ox putting in a similar performance, but Firmino struggling to find a teammate, but not for lack of trying.
Anyone shirking. Not really for me to say, substitutions included.
So Who's the Best Passing Team in the Premier League?
Manchester City.
Proof?
OK, definition of best passing side. One that makes valuable passes and completes them at well above the league average rates.
That's Manchester City.

Just a summary plot here.
We've combined the cumulative increase in NSxG with the under or over performance in the rate at which these passes are completed.
Manchester City's cumulative, successful passes increased their NSxG by 13% more than you would expect an average side to achieve if they were attempting the same passes Manchester City are inflicting on the opposition.
Huddersfield's successful passes increased their NSxG by 10% less than the average expectation if you had Mr Premier League Average doing your passing. Basically, they aren't very good at passing in areas where it matters more.
So while the bulk of my output appears on these two sites, TPoG does give me the chance to prime some of the new stuff we've developed.
This week on the Infogol site, we revealed the work we've been doing to develop a non-shot xG model. The post can be read HERE
NSxG isn't a new concept, the idea's been around in other sports, such as the NFL for decades, but the fluid nature of football/soccer has made such models very data hungry & time consuming to run on a humble works computer.
I'll use this post to throw in some random thoughts about our NS xG and highlight the advantages and similarities to the more readily seen chance based xG models.
What's NS xG?
NSxG gives a value to every possession in every area of the playing field. It's most usefully expressed in expected goals and describes the likelihood that a possession will eventually turn into a goal.
If you've got the ball deep in your own half, the chance of that possession developing into a goal is tiny. If you've the ball in your opponent's penalty area, it's a lot more.
How can NSxG be Used?
In much the same way as shot based xG. namely to evaluate players and teams, but in the former case it's much more inclusive.
If you successfully move the ball from your own box to the opponents with one raking pass, you'll personally (along with the receiver) get the credit for the improvement in NSxG associated with the pass.
More realistically, if you competently move the ball ten yards upfield, you'll get a small uptick in NSxG. Do it consistently and you might even be ranked as the best at beginning deep lying moves in the Premier League.
What About Mistakes ?
There's risk and reward with every pass attempt. Unintentionally pass to the opposition instead of your deep lying playmaker and you're handing the opponents a fairly big chunk of NSxG, while giving up the small amount you owned prior to the pass.
So it can be used to Evaluate Defensive Actions?
Yes, break up an attack with a tackle or interception and you can cost out the benefit by just summing the pre and post event NSxG for both teams.
What About Backward Passes that Find a Team Mate?
They'll lose NSxG, for the player making the pass, but they can be classified separately and might reveal the required role of the player or the tactical mode a side has slipped into, perhaps when defending a lead.
It's a harsh system that penalizes a player for taking the kick off.
Can It Only Be Used for Passes?
No, it can be applied to any recorded action, running with the ball burns calories and gradually ticks up the change in NSxG (provided you're running in the right direction).
Who Benefits from an NSxG Model.
Players who don't regularly provide a key pass or get onto the end of lots of chances. If you're the one breaking up the opposition's midfield passing or tasked with circulating the ball you've been bypassed by attacking event based expected goals.
NSxG shows everyone what you do
Can You Show That Players or Teams Over or Under Perform a NSxG Model?
Easily. Build your baseline model around the entire Premier League and you can estimate not only the worth of advancing the ball from A to B, but also how often an average Premier League side would expect to successfully achieve the pass or run.
Then you just see how often a particular team/player fares compared to the league average.
Is it Better than Normal xG?
Not really better, just different. Usual xG does really well at rating teams, but less well at picking out individual contribution or mistakes.
If you've help craft a sublime move that goes the length of the pitch only for a team mate to fall over his or her own feet and lose the ball, you'd like some credit (& perhaps a black mark against your clumsy colleague, especially if he or she makes a habit of it).
Any Examples?
Here's the Liverpool 4 Manchester City 3 game from January broken down by the pass related NSxG for all the players.

There's a lot of numbers, so it's colour coded, blue is good, red is not so, although the jury is still out on the final column.
First numerical column is the cumulative increase in NSxG by each player's successful passes.
The Ox, Firmino and Mane showing up well. Gomez perhaps a surprise being so prominent? (I don't watch much Liverpool). Mo would show up more, I assume if we included the pass receiver as well, rather than just the passer.
De Bruyne unsurprisingly topping City's numbers, with Otamendi stepping up to help with the game chasing.
Next column is the NSxG "lost" by successful backward passes. Just ball re-circulation really.
Third column is the cumulative net gain through disrupting the opposition's passes. The Ox was definitely up for it that day.
Last column's a bit of a conundrum. It's NSxG lost by a player through misplaced or broken up passes.
You have to ask do you want to penalise your most talented players who try the most difficult passes, such as De Bruyne and the Ox (again).
If you don't have the red in column four, you may not have the blue in column one. Although they might ultimately harm the team by their extravagant pass choices.
It's all risk/reward and passing with purpose.
Here's a week later at the Liberty.
Liverpool losing 1-0 to Swansea.
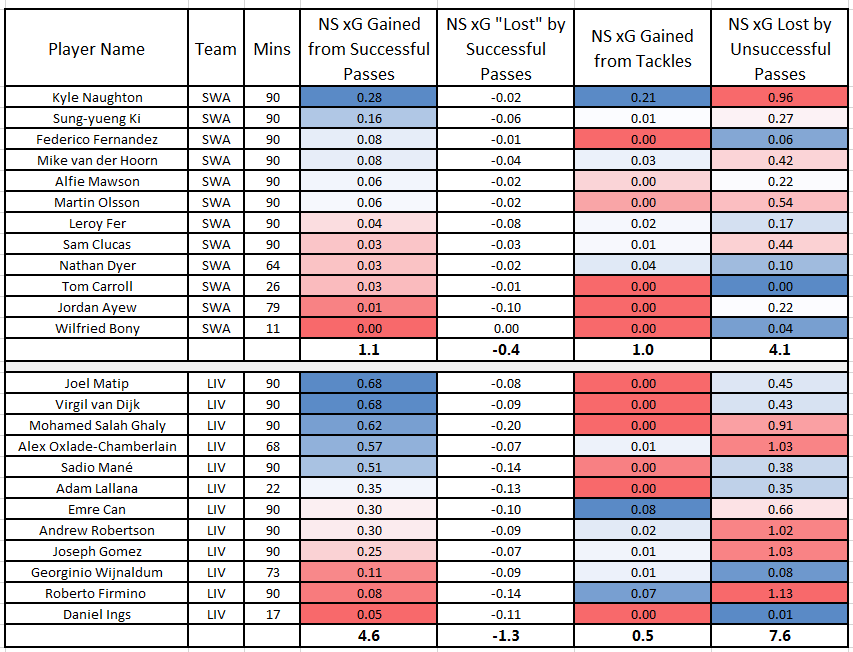
30/70 possession in favour of Liverpool.
Liverpool's defenders stepping up to kick start many of their attacks. Lots of Liverpool passes going astray, but not particularly because of direct Swansea intervention. Ox putting in a similar performance, but Firmino struggling to find a teammate, but not for lack of trying.
Anyone shirking. Not really for me to say, substitutions included.
So Who's the Best Passing Team in the Premier League?
Manchester City.
Proof?
OK, definition of best passing side. One that makes valuable passes and completes them at well above the league average rates.
That's Manchester City.

Just a summary plot here.
We've combined the cumulative increase in NSxG with the under or over performance in the rate at which these passes are completed.
Manchester City's cumulative, successful passes increased their NSxG by 13% more than you would expect an average side to achieve if they were attempting the same passes Manchester City are inflicting on the opposition.
Huddersfield's successful passes increased their NSxG by 10% less than the average expectation if you had Mr Premier League Average doing your passing. Basically, they aren't very good at passing in areas where it matters more.
Tuesday, 27 February 2018
Hitting the Moving Promotion Target.
One inevitable question at this stage of the season is "what's our target to get automatic promotion/get in the playoffs/avoid relegation/get in the Champions League/finish above Arsenal".
The answer is problematical on quite a few levels, not least the phrasing of the initial question.
Does the questioner want a guaranteed outcome or just a target that makes the outcome more likely than not. The former can only be provided for those already leading the race, so a probabilistic reply seems the most suitable.
There's a couple of easy pitfalls to avoid.
For example if you're interested in the chances of a top six finish, the average points won by the sixth placed side isn't that useful. To finish 6th you simply have to narrowly eclipse the points and goal difference won by the 7th placed side.
And with a breakaway big six, such as in the Premier League, the difference between 6th and 7th can be huge.
But the problems don't stop there.
The target for a top 6th finish is most likely different for a side that isn't one of the established big six teams. One of the big six may have a slightly down season, but if you're an outsider looking to break into the top six, your target is likely to be higher than that of a founder member of the big 6.
Complicated.
Even at this late stage of the season, targets are set under the unique circumstances of this particular season, including the intertwined remaining fixture list played out by teams of varying underlying abilities.
The current points target at which Wolves becomes more likely than not to gain automatic promotion from the Championship will be different than Fulham's target.
An inferior Fulham team has to overhaul at least three teams currently ahead of them in the table, without being caught by opponents below them, over a fixture list that includes just one immediate rival.
In contrast, Wolves, the best team in the division, can allow one side to overhaul them, whilst playing out a fixture list that includes three (barely) realistic promotion rivals, giving the Old Gold the opportunity to reduce the points gathering potential of Villa, Cardiff and Derby...or the chasing trio the chance to cut into Wolves' lead.
In short, everyone's running their own unique race, with different challenges and different abilities.
Fulham could get promoted automatically with just 83 points, but in 89% of the occasions they reach exactly 83 points it is insufficient to win that prize.
If Wolves disappointingly win just 83 points, they still go up automatically in 66% of the occasions when they end with this final total.
Two identical final totals, but different probabilistic outcomes for the two sides.
If you want a Fulham points target where automatic promotion becomes more likely than not, it's currently 87 points.
As we've seen for Wolves their "breakeven" points tally is just 83 points and if you want virtual certainty of bringing Premier League football back to Molineux the target to aim for is 90.
Even better news for Wolves is that they get at least 83 points in 3999 out of every 4000 league simulations and at least 90 in 95% of trials.

Here's the rest of the "better than evens" targets for the main contenders for promotion or demotion in the Championship.
Sunday, 25 February 2018
Passive & Aggressive Defensive Teams
One of the major drawbacks in quoting counting statistics in football is the varied time of possession enjoyed by teams.
I first wrote about this nearly seven years ago here when describing Stoke's incredibly disciplined approach to defending once you factored in the inordinate amount of time they spent doing it under Tony Pulis in the early days of their soon to be ending Premier League jaunt.
Defensive statistics have always been blighted by failing to account for opportunity.
It is impossible for a Manchester City defender to accumulate the volume of defensive actions made by say a WBA defender, simply because the new champions are only out of possession for around 30% of a typical game and that game only has around 58 minutes when the ball is in play.
WBA, by contrast are averaging just 40% of the total possession and ceding ~60% to the opposition.
Before we can make any meaningful descriptive attempt at a side's defensive set up, we need to make some kind of attempt to account for the unequal range of possession for each team and the amount of time that the ball spends on the pitch rather than in the stands.
We can also attempt to define where on the field a side is trying to dispossess their opponents.
Some teams are noted for the desire to press opponents higher up the pitch to create a turnover or slow down a developing attack, whereas others are more content to lie deep and only actively engage an opponent once they venture into their final third.
Vertical distance from your own goal can be slightly misleading. If you challenge an opponent on the centre spot you are slightly closer to your own goal than if the event occurs also on the halfway line, but on the touchline.
All calculations have been made from the point of the challenge to the centre of the defending sides own goalline.

The table above using Infogol data has counted the number of defensive actions, such as tackles, interceptions and clearances made by each team after 27 games of the current Premier League campaign.
These have been grouped by distance from the event to the centre of that side's own goal. Finally, these event numbers have been standardised to account for the actual time each side has been without the ball and a figure for defensive actions per 10 minutes of opposition possession has been calculated.
For example, Manchester City appears to have by far the least number of active attempts to disrupt or disposes an opponent in 2017/18, only making around 16 such attempts per 10 minutes of opponent possession.
So they appear happy to allow teams to circulate the ball, but they do make their most concerted efforts to intercede between 20 and 40 yards from the City goal.
In contrast, Liverpool are much more aggressive at trying to regain the ball, making over twice as many defensive actions per 10 minutes than City, as well as engaging opponents almost once a minute at distances of 50 or more yards from Liverpool's own goal.

The final sparkline plot shows, not only the total volume of defensive actions per 10 minutes of opponent possession, but also where a side is most active in engaging their opponent.
A side's own goal is on the left of the plot and volume of actions take place further away from a side's own goal as you move towards the extreme right of the sparkline.
The majority of the top six teams peak their defensive actions between 30 and 40 yards from goal, whereas the remainder of the league by a majority either chose or are forced to defend between 10 and 20 yards from goal.
The most prominent example of a top six team residing in a relegation threatened defensive mindset is Manchester United.
Subscribe to:
Posts (Atom)