Pages

Thursday, 28 January 2016

Happy Birthday, Peter Crouch.

It is nearly a year since I had the pleasure of helping Simon Gleave in putting together a presentation at the 2015 OptaProForum. The presentation looked at the ageing curve within the Premier League, so I thought I'd take advantage of the upcoming anniversary to reprise the theme.

But first.

Tuesday night saw the conclusion of a largely low quality league cup semi final between Stoke and Liverpool, won after extra time and penalty kicks by the Reds.

The tie, particularly the second leg was awash with narratives waiting to be seized upon by the commentators and pundits.

Corner kicks, we were told were Liverpool's weakness and Stoke's strength (circa 2010, maybe). Could the beleaguered Benteke redeem himself as a second half sub. Might Stoke's, Everton supporting Jon Walters score against their Merseyside rivals or Klopp march the Reds to new heights, despite barely shifting the statistical performance dial.

Once the game went to extra time and especially following Flanagan's red card substitution, penalty kicks became the focus of attention and it was left to Twitter to propagate the by now hoary old myth that the team shooting first wins 60% of the time.

Stoke had that privilege, promptly lost and all that was left was for Klopp to pronounce Liverpool deserved victors on the night. Rose tinted, rather than new designer specks.

One of the many possibly story lines did actually unfold. Peter Crouch ex Liverpool missed in the shootout for Stoke, although the media for once failed to demonise a player for failing with an opportunity that is missed around 20% of the time.

Crouch is nearing the end of a highly successful career. He will be 35 on Saturday, when Stoke take on Palace in the FA Cup. Save for a couple of formative seasons bouncing around the loan circuit from the Isthmian, to the Swedish and finally the English second tier, he has played exclusively in the Premier League for a variety of clubs.

Spurs, Liverpool, Villa, Southampton, Portsmouth and currently Stoke have all enjoyed the benefits of  6'7" Crouch being "much better on the ground than you give him credit for".

"The Windmill", Crouchie's short lived follow up to "The Robot".
The general ageing profile for out field Premier League players follows a path of gradual improvement through physical maturity and greater experience. Before the former leads to a decline in the physical side of the game that eventually cannot be compensated by an increase in the latter.

27 or 28 appears to be the stage when a player is at a peak and thereafter a decline in performance becomes likely.

A bell shaped plot, often using playing time as a proxy for performance neatly demonstrates the rise and fall of a players career path.

An alternative is to chart the changing output of a player from one season to the next. A young player will gain more playing time if he followed the hoped for progression, reaching a peak before an age related decline sees the opportunities given to him begin to decline.

This approach may not produce a clean plot if applied to the career of a single player. Long term injury may eliminate large portions of a season for one player compared to a much larger sample of like for like players. Or a player may fall out of favour, while remaining cushioned by a favourable contract.

In the case of Peter Crouch, the level and squad competition for places was likely more fierce at Liverpool and Spurs compared to Portsmouth and Southampton in their relegation year.

Therefore, if minutes played is used as a proxy for performance, the level of the club at which those minutes were earned should form part of the calculation.

2690 Premier League  minutes as a 31 year old in a Stoke team that earned 45 points has to be measured against 2141 minutes as a 24 year old in an 82 points Liverpool team.


In the plot above, I've created a performance indicator that combines minutes played and the quality of the team in which those minutes were won by the player. I've then plotted the change from season to season and although the plot is inevitably noisy, the trend line is typical of the gradually declining improvement until aged 28, followed by season on season decline until the mid 30's signal a possible need to consider options outside of the Premier League.

Crouchie's performance trend line neatly begins to turn negative around 28.

The noticeable dip in the individual plotted points at 25 is Crouch's final season at Liverpool under Benitez and in competition with Torres.

The January transfer window is perhaps not the best time to turn 35, an asset depreciating before your very eyes, but Crouchie will delight the Stoke fans if he scores the winner against Palace, if selected in the 4th round of the cup.

Sorry, Simon.

Tuesday, 26 January 2016

Tottenham's Title Credentials.

Tottenham appear to be contenders for the Premier League title.

They're five points adrift of leaders Leicester, but just two behind Manchester City and Arsenal. So are ideally placed to benefit when some, if not all of the teams ahead of them drop points in a February fixture list that pits the Foxes against their two nearest rivals.

In terms of expected goals totals from attempts created and conceded, Tottenham has the most impressive expected goal difference so far this season. They are a couple of goals ahead of Manchester City and Arsenal, who are currently neck and neck and significantly ahead of Leicester.

Simulating the season to date based on goal attempts it is Tottenham rather than actual leaders Leicester who are most likely to top the table.

However, in reality the gap that exists between the top four needs to be bridged before Tottenham can claim the title. They may have legitimate claims to be the best team in the Premier League, but luck may have not smiled on them during the first 23 matches in comparison to their rivals, notably Leicester.

League points have already been won and even if they maintain their current superiority over their rivals they only have around a 17% chance of overhauling them and finishing the season in first place.

            Chances of Finishing in a Particular Position in 2015/16 Based on Expected Goals.


Arsenal enter the FA Cup break as the most likely winners of the Premier League by virtue of a slightly easier remaining schedule compared to Manchester City. City has also already played one more home match compared to the Gunners and any January squad strengthened should be allowed to play through in actual results rather than being second guessed.

Arsenal's position however is tenuous. A swing of just a point with City from their current positions would send the odds in favour of the Manchester side and it is currently odds on that someone other than Arsenal will be crowned champions in May.

To evaluate Spurs' season so far we have the goal attempt data for Tottenham and their opponents from their first 23 matches of the season and this may be used to estimate how frequently they might have expected to win each of their league matches to date.

For the opening match of the season the bookmaker's odds suggested that Tottenham had around a 16% chance of winning on their visit to Old Trafford and a 24% chance of a draw. In terms of expected points, Spurs would on average return with 0.72 points based on the odds maker's estimation.

In reality Tottenham created chances that had a cumulative expected goals value of 0.8 of a goal during the match compared to Manchester United's slightly better 0.95 of a goal.

If these rather low goal expectations are played out multiple times, spread over the individual chances created by each team, Spurs would win around 29% of the games, draw 33% and lose 38% and their average return would be 1.22 league points.

So even in a 1-0 defeat to begin the season, Spurs had over performed compared to the expectation of the market by creating and preventing chances that were consistent with them "winning" an average of 1.22 rather than 0.72 points.

    Spurs' Performance Based Against Market Expectations in their First 23 Games of 2015/16.


In only three Premier League games has the division of expected goals in Spurs' matches been consistent with a market under performance from Pochettino's team.

They got about what their below par performance deserved in draws with Stoke and WBA and would not have been flattered if they had won a point while faltering against Newcastle instead of suffering a last minute defeat.

Most frustratingly for Spurs, they did more than enough in their two games with leaders Leicester to have ordinarily won more than the single point they did gain.

Spurs, ready to kick start their title challenge? 
However, such fluctuations between expected and actual outcomes will occur in a season and Spurs, a side that is generally considered a regular top six team by the markets has consistently risen above those expectations in the majority of their games with solid underlying shooting data in 2015/16.

A similar performance in the remaining 15 games will make them credible title contenders.

@WillTGM and @cchappas have run similar analysis on not only Spurs in the following tweets. Just click on their twitter names for the links.

Friday, 22 January 2016

Simulating a Single Game Using Expected Goals in Excel.

I've had a request to post a single game simulation using expected goals in excel.

I've chosen the Stoke v Spurs game in the penultimate week of the 2012/13 season, mainly because I took loads of photos at the match, which coincided with Stoke's 150 year celebrations.

Stoke had won just three of their previous 19 games, but two recent victories and a fixture list that threw up Wigan vs Villa on the last weekend, meant that relegation was no longer a threat. Spurs needed the win to keep their hopes alive of overtaking Arsenal for the final Champions League qualifying spot.

The game was played in a constant downpour. Stoke took an early lead through N'Zonzi, Spurs equalised soon after with Dempsey and following a rather predictable Adam red card just after the break, Spurs won the game in the final ten minutes.

Final score 1-2. It was Tony Pulis' final home game as Stoke manager.

Stoke had six goal attempts to Spurs' 25. For simplicity I've ignored related chances from the same attacking move.


The set up is as before. Column "A", the player taking the attempt, "B" his team, "C" the individual goal expectation for the attempt based on your model, "D" a randomly generated number (=rand()), "E" whether the attempt was successful or not.

If the random number is below the goal expectation for the chance, it's a goal. The formula to implement this is shown in the formula box above. Just copy it down for all 31 attempts in the 90 minutes.


Sum the "goals" scored by Stoke. It is the sum of the cells from E2 to E7. For Spurs it is the sum of the cells from E8 to E32.


Now we need to work out the result. Stoke's total goals in the game are in G2 and Spurs' in H2.

If Stoke win G2 must be greater than H2. If that is the case, the formula in I2 returns a "1". If not it returns "0".

For the draw returned in J2, the formula's altered to =IF(G2=H2,1,0). This returns a "1" for a draw or a "0" for a non-draw.

A Spurs win in K2 arises from =IF(H2>G2,1,0)


We're ready to run 1,000 sims of the game. As before drag the number of iterations from 1 to 1000. I've put that in column "H" starting in H4, below the Spurs score.

Then copy the match result into I4 to K4 for each of a Stoke win, a draw or a Spurs win. You put =I2 into cell I4, =J2 into J4 and =K2 into K4.


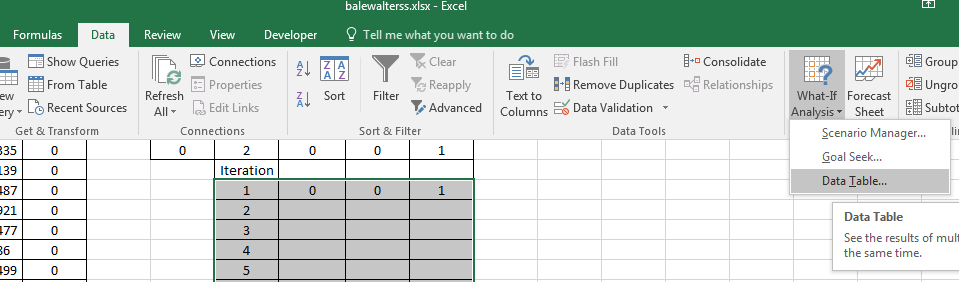
Again highlight the cells where we want the iterations to appear, in this case K1003 to H4.


Again click "Data" on the ribbon, followed by "What-If Analysis" and then "Data Table" on the drop down menu.


 Once again in the action box, click the cursor into the column input cell rather than the row input cell.


Then click in an empty cell. In this instance I've used $F$1003.

Now click "OK" and the results will fill the three column with Stoke wins and a fair few more Spurs victories. This may take a little longer than the previous two simulations for the individual players.


Once the results have fully populated you can sum for the number of Stoke "wins" based on the balance of their attempts compared to those of Spurs.

Should be a close game as long as the ref doesn't spoil it.
Because I've recorded wins/draws and losses simply by a 1 or a zero, if you take the average of i4;i1003 , j4:j1003 and k4:k1003 this will give you the proportion of iterations that resulted in either of the three possible outcomes.

In this case 8.6% Stoke wins, 18.6% draws and 72.8% Spurs wins.