People process information in various ways,some prefer words while others are more able to interpret graphics.So this post is aimed squarely at the latter group.There's little ground breaking stuff here,but the graphs do nicely illustrate the kind of things successful teams accumulate along the way.The horizontal axis of each graph plots each team's success rate,so the further to the right a team is the better they are.Any team which appears to be out of position on the plotted points is worth investigation,there's usually in an interesting descriptive story to be discovered,just don't expect the trait to continue.
Hover over the plotted points with the cursor to reveal the team's identity or click on the legend above the graph and use the highlight control that appears towards the top right of the legend menu.Most teams are colour coded with their own colours and the master menu can be found in the top left hand corner of the grid.
We'll get more adventurous with the various interactions in later posts,so stay tuned.
Goals Scored per Game Compared to Team Success Rate.
Goals Allowed per Game Compared to Team Success Rate.
Average Goal Differential per Game compared to Team Success Rate.
Average Corners Won per Game Compared to Success Rate.
Average Corners Conceded per Game Compared to Success Rate.
Average Corner Differential per Game Compared to Success Rate.
Tuesday, 29 November 2011
Monday, 28 November 2011
Penalty Kicks in the EPL.
Irishman,William McCrum is widely credited as being the proposer of the penalty kick in football.Borrowed from it's near cousin,rugby football,the penalty kick was introduced to punish foul play near to the goal line and was implemented in 1891 following an incident where Stoke City were denied a score by a Notts County hand.The Football League's current oldest teams neatly combining to invent gamesmanship. Appropriately,Stoke were almost immediate beneficiaries of the new Law when they were awarded a spot kick to tie the match in the dying minutes of game against Aston Villa.Unfortunately,but perhaps unsurprisingly to Stoke supporters,justice still wasn't given a chance to prevail.The Villa goalkeeper cunningly booted the ball out of the ground and by the time it had been retrieved the referee had called fulltime and ended the game.Cue more tinkering with the Laws to allow time for a penalty to be taken.
Not everyone was happy with McCrum's addition to the game,the public school educated Corinthians were unable to contemplate that a gentlemen would ever deliberately try to cheat an opponent and so they deliberately shot their penalties wide of the posts.However,their moral stance wasn't embraced by anyone else and the Irishman's invention became the single most dramatic event that can occur during a game.Ironically,McCrum was not only a visionary,he was also a goalkeeper.
Fast forward to today and the penalty kick has become a pivotal point of many games.The low scoring nature of football means that a large proportion of scores are important and do induce large swings in "in game" win probabilities.They are also great theatre containing an ever changing cast of heros, villains and a hint of conspiracy often played out over a relatively protracted timescale where audience participation is almost obligatory.Allegiances and differing lines of sight and perspective change radically a person's honest opinion of what happens on a football pitch.With subjective interpretation inevitably playing a part in the awarding of fouls,one man's penalty can often appear to be another man's corner kick.As the Manchester United Newcastle game so aptly demonstrated at the weekend.
Few will feel much sympathy with Manchester United following Saturday's controversial and almost certainly incorrect decision to allow Demba Ba a chance to equalise from the spot as there is an ingrained opinion amongst supporters of other teams that ManU,especially at Old Trafford receive more than their share of decisions,including penalties.The Red Devils certainly have had the lions share of spot kicks awarded in their favour over the seasons.Eight of the ten penalties awarded in their games in 2009/10 were given to them,six out of six in 2007/08,seven out of eight in 2002/03.Sir Alex is no doubt wondering what went wrong last year when they were given just five out of 11.
To see if there is any justification in the paranoia surrounding the awarding of penalties,we must first construct a reasonable explanation as to how they are won.When Manchester United were given eight penalties in 2009/10 they also scored over 80 EPL goals,so they obviously did the majority of the attacking in their games.Goals are the inevitable by product of attacking football,so are corners and also,it would be reasonable to assume are penalties.We would therefore expect the number of penalties a team receives to be intimately linked to the number of goals they score. I therefore took the penalty data for EPL teams that had been members of the EPL for three seasons or more spread over the last decade or so and averaged the percentage of penalties those teams were awarded and compared it to the percentage of goals they had scored in their games over the same period.
The relationship between the percentage of goals a team scores in matches and the percentage of penalties those teams also receive.

As we can see the relationship is very strong.Teams which score more frequently also gain proportionally more penalties.The sample size isn't large and penalties are relatively infrequent events,occurring on average once every 5 games,so it's probably unwise to take the plot entirely at face value.The slope of the graph does tentatively imply that rather than enjoying an overly generous glut of penalties,the better teams fair slightly worse proportionally compared to their lesser rivals.However,the graph does enable a route to estimating the likelihood of a game having a penalty and then extending this to include who is the more likely to receive the award.
Future games can be conveniently expressed in terms of how many goals on average each team will score in a matchup.For example a typical "top vs bottom" clash would see one team scoring 2 goals and the other averaging 0.8,this is happily the same currency we've used to plot the graph above.The better team will average just over 70% of the goals in this type of game and therefore by reference to the graph they can also expect to receive around 70% of the penalties awarded.If we assume any game has around a 20% chance of seeing a penalty awarded,we can therefore deduce that the favoured team has around a 1 in 7 chance of being given a spot kick in a game of this type.A similar calculation gives the outsider a 1 in 16 chance of getting the verdict.
Not everyone was happy with McCrum's addition to the game,the public school educated Corinthians were unable to contemplate that a gentlemen would ever deliberately try to cheat an opponent and so they deliberately shot their penalties wide of the posts.However,their moral stance wasn't embraced by anyone else and the Irishman's invention became the single most dramatic event that can occur during a game.Ironically,McCrum was not only a visionary,he was also a goalkeeper.
 |
| A then non league Burton Albion convert at their now defunct Eton Park. |
Fast forward to today and the penalty kick has become a pivotal point of many games.The low scoring nature of football means that a large proportion of scores are important and do induce large swings in "in game" win probabilities.They are also great theatre containing an ever changing cast of heros, villains and a hint of conspiracy often played out over a relatively protracted timescale where audience participation is almost obligatory.Allegiances and differing lines of sight and perspective change radically a person's honest opinion of what happens on a football pitch.With subjective interpretation inevitably playing a part in the awarding of fouls,one man's penalty can often appear to be another man's corner kick.As the Manchester United Newcastle game so aptly demonstrated at the weekend.
Few will feel much sympathy with Manchester United following Saturday's controversial and almost certainly incorrect decision to allow Demba Ba a chance to equalise from the spot as there is an ingrained opinion amongst supporters of other teams that ManU,especially at Old Trafford receive more than their share of decisions,including penalties.The Red Devils certainly have had the lions share of spot kicks awarded in their favour over the seasons.Eight of the ten penalties awarded in their games in 2009/10 were given to them,six out of six in 2007/08,seven out of eight in 2002/03.Sir Alex is no doubt wondering what went wrong last year when they were given just five out of 11.
To see if there is any justification in the paranoia surrounding the awarding of penalties,we must first construct a reasonable explanation as to how they are won.When Manchester United were given eight penalties in 2009/10 they also scored over 80 EPL goals,so they obviously did the majority of the attacking in their games.Goals are the inevitable by product of attacking football,so are corners and also,it would be reasonable to assume are penalties.We would therefore expect the number of penalties a team receives to be intimately linked to the number of goals they score. I therefore took the penalty data for EPL teams that had been members of the EPL for three seasons or more spread over the last decade or so and averaged the percentage of penalties those teams were awarded and compared it to the percentage of goals they had scored in their games over the same period.
The relationship between the percentage of goals a team scores in matches and the percentage of penalties those teams also receive.

As we can see the relationship is very strong.Teams which score more frequently also gain proportionally more penalties.The sample size isn't large and penalties are relatively infrequent events,occurring on average once every 5 games,so it's probably unwise to take the plot entirely at face value.The slope of the graph does tentatively imply that rather than enjoying an overly generous glut of penalties,the better teams fair slightly worse proportionally compared to their lesser rivals.However,the graph does enable a route to estimating the likelihood of a game having a penalty and then extending this to include who is the more likely to receive the award.
Future games can be conveniently expressed in terms of how many goals on average each team will score in a matchup.For example a typical "top vs bottom" clash would see one team scoring 2 goals and the other averaging 0.8,this is happily the same currency we've used to plot the graph above.The better team will average just over 70% of the goals in this type of game and therefore by reference to the graph they can also expect to receive around 70% of the penalties awarded.If we assume any game has around a 20% chance of seeing a penalty awarded,we can therefore deduce that the favoured team has around a 1 in 7 chance of being given a spot kick in a game of this type.A similar calculation gives the outsider a 1 in 16 chance of getting the verdict.
Saturday, 26 November 2011
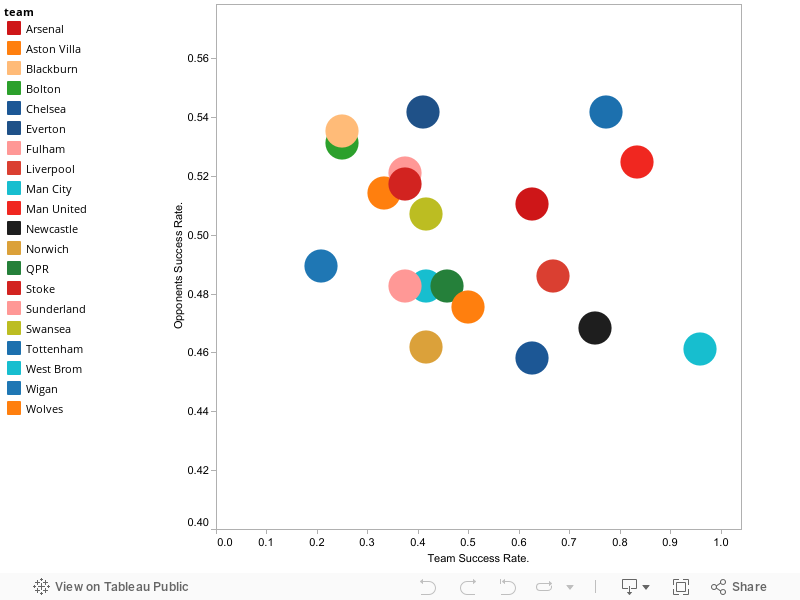
Strength of Schedule so far for the EPL.
The interactive graph allows you to look at the cumulative success rate for each EPL team's 12 opponents so far this season (just 11 for both Spurs and Everton).Simply hover the cursor over a particular circle on the graph or click on a team name in the grid.The higher up the graph,the stronger the calibre of teams a team has faced and the further to the right of the graph the better the team's present record.For example Tottenham have a very good record and have faced a particularly difficult start to the season.Teams in the bottom left hand region of the graph have had a relatively easy start and possess a poor current record.
Sunderland 1 Wigan 2,Win Probability Graph.
Sunderland 1 Wigan 2.
An alternative representation of the Sunderland Wigan game,plotting the win probabilities for both teams along with the draw probability.A Wigan win was the the least likely outcome until Di Santo's 92nd minute winner claimed all three points and heaped more pressure on Sunderland boss,Steve Bruce.

Scorers:
1-0,Larsson,8'
1-1,Gomez(pen),44'
1-2,Di Santo,90+3'
Expected Points Graphs for EPL Games,November 26th 2011.
Stoke3 Blackburn 1.

Scorers:
1-0,Delap,28'
2-0,Whelan,58'
3-0,Crouch,72'
3-1,Rochina,86'
Bolton 0 Everton 2.

Scorers:
Red Card,Wheater(Bolton),19'
1-0,Fellaini,49'
2-0,Vellios,78'
Chelsea 3 Wolves 0.

Scorers:
1-0,Terry,7'
2-0,Sturridge,30'
3-0,Mata,45'
Manchester United 1 Newcastle 1.

Scorers:
1-0,Hernandez,49'
1-1,Ba(pen),64'
Red Card,Gutierrez,(Newcastle) 79'.
Norwich 2 QPR 1.

Scorers:
1-0,Martin,14'
1-1,Young,59'
2-1,Holt,73'
Sunderland 1 Wigan 2.

Scorers:
1-0,Larsson,8'
1-1,Gomez(pen),44'
1-2,Di Santo,90+3'
WBA 1 Tottenham 3.

Scorers:
1-0,Mulumbu,10'
1-1,Adebayor(pen),26'
1-2,DeFoe,81'
1-3,Adebayor,90+2'
Arsenal 1 Fulham 1.

Scorers:
0-1,Vermaelen(og),65'
1-1,Vermaelen,82'

Scorers:
1-0,Delap,28'
2-0,Whelan,58'
3-0,Crouch,72'
3-1,Rochina,86'
Bolton 0 Everton 2.

Scorers:
Red Card,Wheater(Bolton),19'
1-0,Fellaini,49'
2-0,Vellios,78'
Chelsea 3 Wolves 0.

Scorers:
1-0,Terry,7'
2-0,Sturridge,30'
3-0,Mata,45'
Manchester United 1 Newcastle 1.

Scorers:
1-0,Hernandez,49'
1-1,Ba(pen),64'
Red Card,Gutierrez,(Newcastle) 79'.
Norwich 2 QPR 1.

Scorers:
1-0,Martin,14'
1-1,Young,59'
2-1,Holt,73'
Sunderland 1 Wigan 2.

Scorers:
1-0,Larsson,8'
1-1,Gomez(pen),44'
1-2,Di Santo,90+3'
WBA 1 Tottenham 3.

Scorers:
1-0,Mulumbu,10'
1-1,Adebayor(pen),26'
1-2,DeFoe,81'
1-3,Adebayor,90+2'
Arsenal 1 Fulham 1.

Scorers:
0-1,Vermaelen(og),65'
1-1,Vermaelen,82'
Football Analysis or Learning to Not Love Your Model.
It is heartening to see interest in statistically understanding the game of football starting to gather momentum,even if it is still very much in it's infancy.Data driven analysis both for it's own sake and to challenge some of the more entrenched views of a particular game is often a way to capture and delight new audiences.However,there are also many pitfalls along the way and there is a responsibility to ensure that one flawed,but heartfelt view of a sporting contest is not replaced by an equally incomplete and entrenched one.
Data can and is used to prove almost any preconceived notion and the chosen weapon of choice is almost always "small sample size".Cherry picking limited data,usually relating to one particular team and spread over just one season should be a clear warning note.The data collection process can be labourious and time consuming and therefore it's often beyond temptation to resist a headline grabbing post based on limited,unusual but almost certainly random fluctuations from the norm.
To illustrate this point here's a slightly contrived example.Last season,Team B had a longest run of 2 consecutive away wins,whilst Team M's longest sequence lasted just one game.Team B's sequence of away wins was 30% above the league average and Team M's was 40% below it.Notice how the use of percentages enhances the (non) effect.B were Blackpool and M were Manchester United.That's not to say that amusing footnotes to an EPL season such as this are not of interest,but they are trivia and not repeatable lasting trends.
Randomness exists and there's no reason to expect it to be absent from sporting events no matter how strong a pundit or analyst wants to be able to fully explain what occurs on the field.Players and ex players,who tend to make up the majority of football pundits in the UK,can be excused for erring on the side of talent as the only factor that goes towards deciding a football match.It must be difficult enough to stay focussed while plying your trade in front of 50,000 passionate fans and it would hardly help if you allowed the nagging possibility into your head that luck will play a part in the game's outcome.Talent plays it's part and that can be measured reasonably well,but chance also contributes and that has to be accounted for.
So is larger sample sizes the way to go? Probably.But here too we must tread carefully.Here's another (even more contrived) example.You find an obscure league,but can find no record of match results or league tables,but you do find shot,corners,possession data etc and you use this to construct a predictive algorithm and subsequently to predict the results of many games.A friend who is familiar with the league then provides you with many season's worth of results.So you batch up every game where you predicted that the home team had a 40% chance of winning the game (there are conveniently exactly 100 games in the sample).To your delight you find that your predictions match reality extremely closely.40% of the home teams actually won.
However,your friend quickly points out that half of your 100 games involve very poor teams hosting very good teams,(he estimates the home sides have about a 10% chance of winning) and the other 50 games involve very good teams (with a 70% win chance) hosting poor sides.As you knew nothing of the league none of these facts were apparent to you,but the poor sides on average won 5 of their 50 games and the good home sides won 35 games.Combined they gave you your predicted 40% strike rate despite you wildly overestimating the ability of half of the group and wildly underestimating that of the other half.
The above scenario has been exaggerated for effect,but all groups of large samples suffer from the same problem.Hidden errors or uncertainties exist and can conspire to make a sample of games appear perfectly consistent with our preferred view of the world by simply cancelling each other out.
The rise in independent analysis of sports has arisen in the past through a dissatisfaction with more traditional,subjectively based viewpoints and so there lies a responsibility to fully investigate our methods for any unseen systematic bias in the data,reject spurious sample data no matter how seductive the conclusion may be and generally resist the temptation to love our models too much.
In the next couple of posts I'll show how deeper scrutiny of large samples of games can reveal competing factors that could easily be missed,but once revealed give us a better insight into how the in running win probabilities change depending upon the current game situation.
Wednesday, 23 November 2011
Expected Points Graph for Bayer Leverkusen v Chelsea,November 2011.
Bayer Leverkusen 2 Chelsea 1.

Scorers:
0-1,Drogba,49'
1-1,Derdiyok,73'
2-1,Friedrich,90+1'
Chelsea hardly dominated this game despite being the team most likely to take more points for virtually it's entire duration.A petty low key game,where both teams seemed to be happy with a point became much more of a contest after Drogba's strike just after the break.The hosts were forced into being more adventurous and they soon realised that Chelsea's rearguard was far from secure.Chelsea will point with some justification to a penalty for a foul on Drogba that was missed by the multitude of officials,but Friedrich's late strike makes their final game with Valencia a must win or must not concede affair.
Tuesday, 22 November 2011
Expected Points Graphs for EPL Games,November 19th 2011.
Norwich 1 Arsenal 2.

Scorers:
1-0,Morison,16'
1-1,van Persie,27'
1-2,van Persie,59'
Everton 2 Wolves 1.

Scorers:
0-1,Hunt(pen),37'
1-1,Jagielka,44'
2-1,Baines(pen),83'
Stoke 2 QPR 3.

Scorers:
1-0,Walters,8'
1-1,Helguson,22'
1-2,Young,44'
1-3,Helguson,54'
2-3,Shawcross,64'
Wigan 3 Blackburn 3.

Scorers:
0-1,Yakubu,2'
1-1,Gomez,8'
2-1,Caldwell,31'
Red Card,Dunn(Blackburn),48'
2-2,Hoilett,60'
3-2,Crusat,88'
3-3,Yakubu(pen),90+9'.

Scorers:
1-0,Morison,16'
1-1,van Persie,27'
1-2,van Persie,59'
Everton 2 Wolves 1.

Scorers:
0-1,Hunt(pen),37'
1-1,Jagielka,44'
2-1,Baines(pen),83'
Stoke 2 QPR 3.

Scorers:
1-0,Walters,8'
1-1,Helguson,22'
1-2,Young,44'
1-3,Helguson,54'
2-3,Shawcross,64'
Wigan 3 Blackburn 3.

Scorers:
0-1,Yakubu,2'
1-1,Gomez,8'
2-1,Caldwell,31'
Red Card,Dunn(Blackburn),48'
2-2,Hoilett,60'
3-2,Crusat,88'
3-3,Yakubu(pen),90+9'.
Monday, 21 November 2011
A Century of Competitive Balance and Dominance.
The competitive balance in the EPL and it's predecessor,the English Division One has been steadily becoming more unequal for the last 100 seasons.The share of all the good things that can happen to a team over the course of a season,the goals,the wins and the points are increasingly ending up in the hands of fewer teams.Whether you look at wins or success rate (wins + half the number of draws divided by total games),the standard deviation,which measures the dispersion from the mean or average value has trended to larger figures for most of the last century and continued into the present one.A larger standard deviation indicates that the data points are spread out over a larger range,in other words the top teams are grabbing more wins than their counterparts did previously.
The upward trend can be seen if we plot the seasonal standard deviation for the top division's success rate from 1920 onwards.Seasonal variation appears to have been more volatile in the immediate post war period,but the race to a more polarised sharing of the spoils is less steep in the league's earlier years.In the EPL era and especially from the noughties onwards,season on season variation is much more consistent,but the steepness of the trend curve is more relentless.

We can illustrate how unequal a league has become if we compare the actual standard deviations to the theoretical values that would occur if the league consisted of entirely equal teams.A league consisting of equally talented teams would see each team on average having a seasonal success rate of 0.5.However,random chance would dictate that while some would end individual years with exactly that figure,other teams would have slightly more or less than 0.5.The size of this dispersion around 0.5 would determine the standard deviation for a coin toss season and by comparing this random SD with actual SD's from real seasons,we can gauge how unbalanced the real life situation is.Repeated simulations of a coin toss season,for either a 38 game season (as the EPL has predominately been) or a 42 game season for the old First Division gives standard deviations of around 0.08 for team success rates.
The standard deviation for success rate over the period of topflight English league football post World War One averages out at 0.105 an increase of 34% on the value obtained from a league decide entirely by random chance.However,the trendline shows a distinct upturn after the formation of the EPL in 1992/93 and this is borne out by the average SD increasing to 0.132 if we just consider the EPL years.An increase this time of just over 60% compared to a perfectly equal initial state.
If we refer back to the graph we can say that in the early post WW1 years some seasons produced tables that were not inconsistent with the league members being extremely closely matched in terms of talent.As we moved through the decades the disparity of talent became more pronounced and in the EPL era,talent and therefore proportion of wins became concentrated amongst a select group of four,possibly five teams.
By contrast with the current EPL,the NFL actively seeks to prevent the concentration of talent in a few teams and tries to promote parity of opportunity.If we repeat the process using NFL wins and ties mimicking the EPL's success rate and further account for a season that has just 16 regular season games we find that since the NFL AFL merger in 1970 the expected win/tie standard deviation was about 0.125.The actual average SD over the same period was 0.19,an increase of about 50% compared to a coin flip version of the NFL.
The Dispersion of Success Rates for various Sports Leagues.
So the English top flight football league from 1920 was actually more equal than the genetically engineered NFL since the merger,although the situation is reversed if we consider standard deviations for just the EPL since it's inception.The EPL has been won by just four teams over it's lifetime,Man U,Arsenal,Chelsea and Blackburn,while the NFL has had 12 different teams lift the Vince Lombardi Trophy over the same 19 year period.These numbers appear to confirm that the NFL is indeed more egalitarian than the EPL.The standard deviation of NFL team's seasonal success rate is proportionally closer to a coin flip league than is the EPL and many more EPL teams than the thirty or so American football teams who compete in the NFL have tried to win the EPL title and only 4 have actually succeeded compared to three times that number for the NFL.
However,the parity in the NFL is partly an illusion.The knockout nature of the NFL post season,even with the inbuilt advantages afforded to the highest seeds,means that teams who dominate the regular season often fall by the wayside in the Wildcard,Divisional,Championship and Superbowl stages.The wider spread of ultimate winners in the NFL is partly down to the drive for a level playing field through the elaborate salary cap and draft system,but also it's down to the NFL playing a condensed version of the FA Cup as an encore.
Secondly,the draft system means that many teams go through cycles of rebuilding.Poor teams with little chance of competing are always present and at best it is the identity of the poorest teams that changes.The constant churning from good to bad and back again can be as tediously predictable as a title fought for by the same four teams.
Thirdly,the poorest NFL teams have little to play for once they are out of contention in their division other than a contrived contest to finish as badly as possible to claim the highest draft pick.By contrast the average and below EPL teams,while accepting that they are almost certain to have very little title aspirations,do fight out a very real and season long contest to maintain their EPL status.A contest often as compelling as the battle at the top of the table.A Wigan fan can approach a new season with as much anticipation as a Manchester United fan,it's just their expectations that are different.
So although the figures appear to support the view that the NFL has more parity than the EPL,it does not inevitably follow that it is also a more appealing product*.Competitive balance is but one aspect of a league's attractiveness.Having a dominant and unchanging presence in a league can be good for the health of a league,even if that team skews the competitive balance.Hardcore fans welcome the occasional visit of the very best,even if a favourable result is much less likely and casual fans also care not about seeing a close game,but they too prefer to see the best.Given the choice of a closely matched game or a game featuring Manchester United where the outcome is much more certain,terrestrial TV channels in the UK almost always chose the latter and are rewarded with higher audiences.
*(appealing from the viewpoint of being competitively balanced......both are of course tremendous sports).
Sport and football is greatly affected by randomness even in a league lacking parity and the danger is that an ill considered drive towards equality of opportunity could leave fans as indifferent to a coin toss league as they are supposedly becoming when faced with a league dominated by a small select band of teams.Competitive balance within a league is but one aspect that drives that league's popularity.
Finally,it seems a shame to calculate all these standard deviations and let the go to waste,so as a post script I've calculated standard scores of success rates for each EPL and Division One team since 1920.Standard scores can be used to compare performances from different sets of data,they tell us how many standard deviations a data point is away from that season's average.They cannot tell us that the Champions from 1920 are inherently superior to the champions from 1999,but they can be used to compare how dominant each team was in it's own unique environment.Tactical awareness,fitness levels and the size and distribution of the skill pool obviously changes over time and teams can only perform in their own eras,so we can merely subjectively speculate on how an outstanding team from one era would perform in another.But standard scores can tell us which teams were the most dominant against the opposition they actually faced.
The Most Dominant English League Champions 1920-2011.

The team to dominate a Division One season more than anyone else was Sheffield Wednesday in 1929-30.In an era of two points for a win,The Owls were ten points clear of second placed Derby and 13 clear of third placed Manchester City.To illustrate the scale of Sheffield's achievement,the gap between Manchester City and bottom team Everton was also 13 points.They are followed by Manchester United's Busby Babes from 1955-56 and the list also includes the Danny Blanchflower double winning Spurs,an Everton side featuring their very own goalscoring statistical outlier,Dixie Dean,Don Revie's "dirty" Leeds,inherited and dismantled by Cloughie,a Cantona inspired Man U,an unbeaten Arsenal team and a Mourhinio managed Chelsea.
But by far the most poignant entry is third placed Sunderland.In an era where goal keepers were little protected by the Laws of the Game and sometimes even less so by lax refereeing,their young keeper Jimmy Thorpe died mid way through the season.Officially the cause of death was his diabetic condition,but the reality was that he died through injuries received whilst fielding a backpass in a league game the previous weekend.Increased protection for keepers were quietly ushered into the sport soon afterwards.
The Most Dominant 11 English League Champions 1920-2011.
Sheffield Wednesday appeared to work on the assumption that fans remember either the very best or the very worst,as they also top the table for the top flight team cast furthest adrift from their competitors with an abject 1954-55 effort.They are chased home by Stoke who won just three games in 1984-85,although two of their victims were Arsenal and Manchester United.
The Worst Individual Seasonal Performers 1920-2011.
The upward trend can be seen if we plot the seasonal standard deviation for the top division's success rate from 1920 onwards.Seasonal variation appears to have been more volatile in the immediate post war period,but the race to a more polarised sharing of the spoils is less steep in the league's earlier years.In the EPL era and especially from the noughties onwards,season on season variation is much more consistent,but the steepness of the trend curve is more relentless.
The Dispersion of the Success Rate per Season in the English Division One 1920-2010.
We can illustrate how unequal a league has become if we compare the actual standard deviations to the theoretical values that would occur if the league consisted of entirely equal teams.A league consisting of equally talented teams would see each team on average having a seasonal success rate of 0.5.However,random chance would dictate that while some would end individual years with exactly that figure,other teams would have slightly more or less than 0.5.The size of this dispersion around 0.5 would determine the standard deviation for a coin toss season and by comparing this random SD with actual SD's from real seasons,we can gauge how unbalanced the real life situation is.Repeated simulations of a coin toss season,for either a 38 game season (as the EPL has predominately been) or a 42 game season for the old First Division gives standard deviations of around 0.08 for team success rates.
The standard deviation for success rate over the period of topflight English league football post World War One averages out at 0.105 an increase of 34% on the value obtained from a league decide entirely by random chance.However,the trendline shows a distinct upturn after the formation of the EPL in 1992/93 and this is borne out by the average SD increasing to 0.132 if we just consider the EPL years.An increase this time of just over 60% compared to a perfectly equal initial state.
If we refer back to the graph we can say that in the early post WW1 years some seasons produced tables that were not inconsistent with the league members being extremely closely matched in terms of talent.As we moved through the decades the disparity of talent became more pronounced and in the EPL era,talent and therefore proportion of wins became concentrated amongst a select group of four,possibly five teams.
By contrast with the current EPL,the NFL actively seeks to prevent the concentration of talent in a few teams and tries to promote parity of opportunity.If we repeat the process using NFL wins and ties mimicking the EPL's success rate and further account for a season that has just 16 regular season games we find that since the NFL AFL merger in 1970 the expected win/tie standard deviation was about 0.125.The actual average SD over the same period was 0.19,an increase of about 50% compared to a coin flip version of the NFL.
The Dispersion of Success Rates for various Sports Leagues.
| LEAGUE. | Success Rate SD for a Coin Flip League. | Actual Success Rate SD. | % Increase |
| NFL 1970-2011. | 0.125 | 0.190 | 52% |
| Div 1/EPL 1920-2011. | 0.078 | 0.105 | 34% |
| EPL to Present. | 0.081 | 0.132 | 63% |
So the English top flight football league from 1920 was actually more equal than the genetically engineered NFL since the merger,although the situation is reversed if we consider standard deviations for just the EPL since it's inception.The EPL has been won by just four teams over it's lifetime,Man U,Arsenal,Chelsea and Blackburn,while the NFL has had 12 different teams lift the Vince Lombardi Trophy over the same 19 year period.These numbers appear to confirm that the NFL is indeed more egalitarian than the EPL.The standard deviation of NFL team's seasonal success rate is proportionally closer to a coin flip league than is the EPL and many more EPL teams than the thirty or so American football teams who compete in the NFL have tried to win the EPL title and only 4 have actually succeeded compared to three times that number for the NFL.
However,the parity in the NFL is partly an illusion.The knockout nature of the NFL post season,even with the inbuilt advantages afforded to the highest seeds,means that teams who dominate the regular season often fall by the wayside in the Wildcard,Divisional,Championship and Superbowl stages.The wider spread of ultimate winners in the NFL is partly down to the drive for a level playing field through the elaborate salary cap and draft system,but also it's down to the NFL playing a condensed version of the FA Cup as an encore.
Secondly,the draft system means that many teams go through cycles of rebuilding.Poor teams with little chance of competing are always present and at best it is the identity of the poorest teams that changes.The constant churning from good to bad and back again can be as tediously predictable as a title fought for by the same four teams.
Thirdly,the poorest NFL teams have little to play for once they are out of contention in their division other than a contrived contest to finish as badly as possible to claim the highest draft pick.By contrast the average and below EPL teams,while accepting that they are almost certain to have very little title aspirations,do fight out a very real and season long contest to maintain their EPL status.A contest often as compelling as the battle at the top of the table.A Wigan fan can approach a new season with as much anticipation as a Manchester United fan,it's just their expectations that are different.
So although the figures appear to support the view that the NFL has more parity than the EPL,it does not inevitably follow that it is also a more appealing product*.Competitive balance is but one aspect of a league's attractiveness.Having a dominant and unchanging presence in a league can be good for the health of a league,even if that team skews the competitive balance.Hardcore fans welcome the occasional visit of the very best,even if a favourable result is much less likely and casual fans also care not about seeing a close game,but they too prefer to see the best.Given the choice of a closely matched game or a game featuring Manchester United where the outcome is much more certain,terrestrial TV channels in the UK almost always chose the latter and are rewarded with higher audiences.
*(appealing from the viewpoint of being competitively balanced......both are of course tremendous sports).
Sport and football is greatly affected by randomness even in a league lacking parity and the danger is that an ill considered drive towards equality of opportunity could leave fans as indifferent to a coin toss league as they are supposedly becoming when faced with a league dominated by a small select band of teams.Competitive balance within a league is but one aspect that drives that league's popularity.
Finally,it seems a shame to calculate all these standard deviations and let the go to waste,so as a post script I've calculated standard scores of success rates for each EPL and Division One team since 1920.Standard scores can be used to compare performances from different sets of data,they tell us how many standard deviations a data point is away from that season's average.They cannot tell us that the Champions from 1920 are inherently superior to the champions from 1999,but they can be used to compare how dominant each team was in it's own unique environment.Tactical awareness,fitness levels and the size and distribution of the skill pool obviously changes over time and teams can only perform in their own eras,so we can merely subjectively speculate on how an outstanding team from one era would perform in another.But standard scores can tell us which teams were the most dominant against the opposition they actually faced.
The Most Dominant English League Champions 1920-2011.
The team to dominate a Division One season more than anyone else was Sheffield Wednesday in 1929-30.In an era of two points for a win,The Owls were ten points clear of second placed Derby and 13 clear of third placed Manchester City.To illustrate the scale of Sheffield's achievement,the gap between Manchester City and bottom team Everton was also 13 points.They are followed by Manchester United's Busby Babes from 1955-56 and the list also includes the Danny Blanchflower double winning Spurs,an Everton side featuring their very own goalscoring statistical outlier,Dixie Dean,Don Revie's "dirty" Leeds,inherited and dismantled by Cloughie,a Cantona inspired Man U,an unbeaten Arsenal team and a Mourhinio managed Chelsea.
But by far the most poignant entry is third placed Sunderland.In an era where goal keepers were little protected by the Laws of the Game and sometimes even less so by lax refereeing,their young keeper Jimmy Thorpe died mid way through the season.Officially the cause of death was his diabetic condition,but the reality was that he died through injuries received whilst fielding a backpass in a league game the previous weekend.Increased protection for keepers were quietly ushered into the sport soon afterwards.
The Most Dominant 11 English League Champions 1920-2011.
| TEAM. | Success Rate. | Standard Score. | Season. |
| Sheffield Wed. | 0.71 | 3.13 | 1929/30. |
| Manchester Utd. | 0.71 | 3.04 | 1955/56. |
| Sunderland. | 0.67 | 2.79 | 1935/36. |
| Leeds Utd. | 0.74 | 2.71 | 1973/74. |
| Arsenal. | 0.70 | 2.65 | 1933/34. |
| Everton. | 0.63 | 2.64 | 1927/28. |
| Manchester Utd. | 0.71 | 2.62 | 1992/93. |
| Huddersfield. | 0.68 | 2.62 | 1925/26. |
| Arsenal. | 0.84 | 2.61 | 2003/04. |
| Spurs. | 0.79 | 2.57 | 1960/61. |
| Chelsea. | 0.87 | 2.57 | 2004/05. |
Sheffield Wednesday appeared to work on the assumption that fans remember either the very best or the very worst,as they also top the table for the top flight team cast furthest adrift from their competitors with an abject 1954-55 effort.They are chased home by Stoke who won just three games in 1984-85,although two of their victims were Arsenal and Manchester United.
The Worst Individual Seasonal Performers 1920-2011.
| TEAM. | Success Rate. | Standard Score. | Season. |
| Sheffield Wed. | 0.31 | -2.88 | 1954/55. |
| Stoke City. | 0.17 | -2.76 | 1984/85. |
| Sheffield Wed. | 0.27 | -2.66 | 1919/20. |
| Grimsby. | 0.26 | -2.53 | 1947/48. |
| Leeds Utd. | 0.21 | -2.41 | 1946/47. |
| Crystal Palace. | 0.23 | -2.38 | 1980/81. |
| Blackburn. | 0.24 | -2.36 | 1965/66. |
| Portsmouth. | 0.25 | -2.32 | 1958/59. |
| Leyton Orient. | 0.25 | -2.30 | 1962/63. |
| Wolves. | 0.27 | -2.29 | 1983/84. |
| Sunderland. | 0.20 | -2.24 | 2002/03. |
Chelsea 1-2 Liverpool,November 2011.
Chelsea 1 -2 Liverpool.

Scorers.
0-1,Rodriguez,33'
1-1,Sturridge,55'
1-2,Johnson,87'

Scorers.
0-1,Rodriguez,33'
1-1,Sturridge,55'
1-2,Johnson,87'
Wednesday, 16 November 2011
Red Cards.What To Expect After One is Shown.
Bolton 2-2 Birmingham,EPL August 2010.
When Jussi Jaaskelainen aimed at kick at Birmingham's Roger Johnson and followed it up with a slap around the head a red card was inevitable.Bolton already trailed Birmingham by virtue of Johnson's 4th minute goal and the longterm hole they had dug for themselves got even deeper when they fell further behind just after the break.However,spurred on by a home crowd and the recipients of a couple of generous refereeing decisions they claimed an unlikely point with two late goals.
Newcastle 4-4 Arsenal.EPL February 2011.
This game has been described here.Arsenal had a 4 goal cushion when Diaby was dismissed after 50 minutes,but they weren't quite as resilient as Bolton had been in the previous example and the 10 men Gunners were grateful to return to London with a point.
We have seen that on average a red card reduces a team's in game win probability,but as the two games above demonstrates there is a wide range of possible outcomes that can materialise on the actual matchday.Taken in isolation the Bolton game could be used to justify the often repeated and totally erroneous cliche that "it is (always) harder to play against 10 men than 11".While the Arsenal game dramatically demonstrates the actual real life experience where the numerically reduced side more usually finds scoring and defending much more difficult.
To discover what happens on average it is necessary to take a large number of games and record the scoring patterns of the teams both before and after the red card was shown.I've taken each game during the 2010/11 season where a solitary red card was issued,comprising 45 games in total.The soon to be ten men scored less goals than their opponents in the time prior to the red card being shown,confirming the findings here and here that red cards are more likely to be shown to inferior sides forced to make more defensive challenges or to good sides playing badly and reacting petulantly to this unexpected dip in form.
Scoring and conceding record of red carded sides prior to the red card.EPL 2010/11.
In total 70 goals hit the back of the net prior to the dismissal in the 46 games and 40% of them were scored by the team about to see red.
Scoring and conceding record of red carded sides after the red card.EPL 2010/11.
When Jussi Jaaskelainen aimed at kick at Birmingham's Roger Johnson and followed it up with a slap around the head a red card was inevitable.Bolton already trailed Birmingham by virtue of Johnson's 4th minute goal and the longterm hole they had dug for themselves got even deeper when they fell further behind just after the break.However,spurred on by a home crowd and the recipients of a couple of generous refereeing decisions they claimed an unlikely point with two late goals.
Newcastle 4-4 Arsenal.EPL February 2011.
This game has been described here.Arsenal had a 4 goal cushion when Diaby was dismissed after 50 minutes,but they weren't quite as resilient as Bolton had been in the previous example and the 10 men Gunners were grateful to return to London with a point.
We have seen that on average a red card reduces a team's in game win probability,but as the two games above demonstrates there is a wide range of possible outcomes that can materialise on the actual matchday.Taken in isolation the Bolton game could be used to justify the often repeated and totally erroneous cliche that "it is (always) harder to play against 10 men than 11".While the Arsenal game dramatically demonstrates the actual real life experience where the numerically reduced side more usually finds scoring and defending much more difficult.
To discover what happens on average it is necessary to take a large number of games and record the scoring patterns of the teams both before and after the red card was shown.I've taken each game during the 2010/11 season where a solitary red card was issued,comprising 45 games in total.The soon to be ten men scored less goals than their opponents in the time prior to the red card being shown,confirming the findings here and here that red cards are more likely to be shown to inferior sides forced to make more defensive challenges or to good sides playing badly and reacting petulantly to this unexpected dip in form.
Scoring and conceding record of red carded sides prior to the red card.EPL 2010/11.
| Goals Scored by Red Carded Side Prior to Card. | Goals Allowed by Red Carded Side Prior to Card. | Percentage of Match Goals Scored by Carded Side. |
| 28 | 42 | 40% |
In total 70 goals hit the back of the net prior to the dismissal in the 46 games and 40% of them were scored by the team about to see red.
Scoring and conceding record of red carded sides after the red card.EPL 2010/11.
| Goals Scored by Red Carded Side After Card. | Goals Allowed by Red Carded Side After Card. | Percentage of Match Goals Scored by Carded Side. |
| 15 | 36 | 29% |
The average time at which the dismissal occurred was the 64th minute and ranged from numerous injury time cards to Boyata's 5th minute departure from the Man City Arsenal game.With just 21 players on the pitch things became much more difficult for the even numbered side and they now only scored 29% of the total goals scored compared to 40% previously.So although teams who perform heroically in the face of lopsided numerical odds tend to stick in the memory,usually as a result of inflated media interest,it is the well behaved side who much more often derive the advantage from a dismissal.
The average time of the card also allows us to see how the overall goalscoring differs pre and post dismissal.Some of the games in the sample are mis matches at the start and they will tend to be slightly more goal laden than a more usual English Premiership game.However,overall the sample of games would expect to have just slightly above 2.6 goals scored per game.We know that the average time of the dismissal is the 64th minute and we can fairly easily work out the rate at which goalscoring decays over the course of the game.In a game where an average of 2.6 goals were expected to be scored,we would expect an average of 1.05 goals to be scored after the 64th minute.If we compare the actual total number of goals scored by both teams after the red card we can not only say what proportion of goals will be scored by either team,but also how much more or less goalscoring occurs.
The 45 games produced 51 post card goals at 1.13 goals per game,slightly higher than the pre game expectation for the number of goals that would be scored after the 64th minute in a well behaved game.However,every game starts with a kickoff,but some of the red card "mini" games that lasted on average from the 64th minute onwards started unsurprisingly with a penalty kick and if we allow for these occurrences we can probably say with confidence that games blighted by red cards produce just as many goals as normal games.It's just the scoring distribution that is changed.
So if you're at a game and a red card is shown,you'll still get your money's worth in terms of goals scored,but expect the numerically superior side to do more than their pre game expected share of the scoring.
Saturday, 12 November 2011
Estonia 0-4 Rep of Ireland,Euro 2012 Playoff.
Estonia 0 Rep of Ireland 4.
Ireland all but guaranteed qualification for Euro 2012 and banished sour memories of William Gallas' controversial goal for France in the same stage of the qualification process for World Cup 2010.For a team as adept at defending as the Irish any lead from the first leg would have been welcome.But clinical finishing from players from such diverse club sides as Stoke,LA Galaxy and Blackburn and an Estonian self destruction mode that prevailed all night means that Tuesday's return leg should be a formality.

Scorers.
0-1,Andrews,13'
0-1,Red Card,Stepanov,34'
0-2,Walters,67'
0-3,Keane,71'
0-3,Red Card,Piiroja,77'
0-4,Keane(pen),88'
Thursday, 10 November 2011
Drawing the Wrong Conclusions.Draws in the EPL.
In a case of extreme Karmic Retribution,Bolton inflicted a 5-0 thrashing on Stoke at the Reebok on Sunday.The result may have gone some way to easing the pain their players and fans suffered at Wembley on a very sunny afternoon in April 2011 when The Potters beat The Trotters by the same scoreline to reach the FA Cup Final.It was also equally noteworthy because it extended Bolton's run of games without a draw to 21 league games,more if you include cup ties.The run of non drawn games is certainly unusual,the next longest current run for teams in all games is 13 shared by Nottingham Forest and Peterborough,but is it so unusual that we have to assume that Bolton have a unique (ish) quality that is leading to definite outcomes in games they play?
 |
| Bolton don't appear to do Draws. |
There is much less variation in the likelihood of games in the EPL ending all square compared to games ending with say a win.Even when the very best play the very worst there's still around a 20% chance that the game will end deadlocked and in the vast majority of run of the mill match ups that are played the probability of a draw doesn't move much from 26 or 27%.Therefore,we can fairly easily model an extended sequence of games where the odds of a draw is in the region of 27% and the odds of a non draw is 73%.If you enter =rand() into a spreadsheet the cell will return a number between 0 and 1 and if you designate any return below 0.27 as a draw you have your very own,primitive draw generator.In the run of simulated draws I have just done a sequence of 25 consecutive non draws occurred after just 77 games,the next one appeared 700 games later.
So it would seem that although an extended run of non draws is relatively rare,if you look at enough games one such run is bound to occur.Bolton weren't designated as the team to watch for if you wanted a definite outcome before they started their run of non draws and by monitoring the EPL as a whole over a long enough time scale a team with Bolton's unusual sequence of results was bound to appear by chance.It just happened to be The Trotters.
World famous illusionist,Derren Brown does a trick where he tosses a coin to come up heads ten times in a row.It's shot in realtime with no video editing and it happens just as it appears on film.What isn't shown is the probable hours of coin tossing that preceded the run of ten heads.Shown out of context the ten consecutive heads seem remarkable instead of just uncommon and it's the same with Bolton's current run.It's certainly uncommon,but no so remarkable,in the context of 20 EPL teams constantly playing sequences of games,that we have to look for reasons why Bolton don't do draws.Bolton's 25 games without a draw are indistinguishable from a naturally occurring sequence in a much larger sample of games.
If non drawing teams occur largely at random,what about so called draw specialists.We could repeat the simulation on a team by team and season on season basis to see how common an unusually large number of draws were in the simulation,but instead I've taken so called draw specialists and seen how frequently they drew games in their next season in the top flight.If draws were for example a tactically based,repeatable talent we would expect a lot of teams to be able to retain this trait across seasons.A few do,but again this could just be a continuation of the random process,but most do not.Home teams who recorded the most home draws in season N averaged 8.4 draws per 19 games since 1988,but in season N+1 they only averaged 5.6 draws and just 15% of the teams equalled or bettered their previous draw total.Away draw specialists showed similar figures.The average number of home or away draws in the English top flight over that period was 5.3 draws,so draw specialist are most likely random streaks and the teams on average fall back to earth in subsequent seasons.
Average Number of Draws by Venue for the most Draw Prone Teams in the English Top Flight.1988-2011.
| Draw Prone Team Type. | Average Number of Draws per Season. | Average Number of Draws Next Season. |
| Home Teams. | 8.4 | 5.6 |
| Away Teams. | 8.8 | 5.6 |
Tuesday, 8 November 2011
Scoring the First Goal.
Football is in contrast to many other popular sports low scoring and that in part makes it a tense experience to participate in both as a spectator or a competitor.Therefore an opening goal when viewed within the context of a single game is very valuable to the scoring team.We can do a ball park calculation to demonstrate this importance.A game has on average 2.6 goals and lasts 94 minutes,so the first goal will on average be score after about 35 minutes (it's actually later).If we then assume a typical home side would be expected to score 1.5 goals and their visitors 1.1 we can calculate that the Expected Points for the home side if they score first would be 2.4 points and they would avoid defeat in 92 games out of 100.Even the visitors would return with points over 80 times per hundred games should they draw first blood and they'd average about 2 points per game where they took the lead.
Having established that opening goals are hugely influential in individual games our next step is to try to come to a method that will indicate which team is more likely to score first.Probably one of the most famous opening goals was scored by San Marino against England in 2003.Although it didn't materially affect the result it was a surprising enough event to suggest that weaker teams are less likely to score first.We can test this intuitive assumption by collecting a large enough sample of games and record the identity of the first team to score and the pre game goal expectancies for each team.If we do this we find that in games where a first goal was scored the proportion of a team's pregame goal expectancy compared to the total goal expectancy for the game is near enough equal to the proportion of first goals that that team scores.
An example is probably in order.If a team would expect,on average to score 2 goals and concede 0.8 goals in a match or score 71.4% of the goals,it will also score about 71.4% of the opening goals in that matchup where a goal occurs.
Therefore we can say that scoring the first goal is a talent based skill,but the case of San Marino and England also indicates that short term outcomes and insufficiently large sample sizes can lead to less likely streaks appearing.If we imagine for a minute that the EPL is a coin flip league with no home advantage and each team has a 50% chance of scoring first in all 38 games.If we simulate 38 coin tosses and repeat it 20 times for each EPL team we would quickly find a team that appeared to score first much more frequently than 50%.But as we've used the same "coin" for each sequence we couldn't have found a team who specialised in scoring the opening goal,we've just hit an unusual sequence partly through a team's skill and partly through pure chance.Of course the EPL isn't a coin flip league,but it is still prone to short term streaks being mistaken for long term trends.
If we use pre game goals expectations to calculate the proportion of first goals the EPL teams were expected to score over a season and realise that 38 games are likely to produce sequences of games that have been more heavily influenced by good fortune that others,we can start to see which teams may have occupied false finishing positions in the final table.We saw here that it was likely that Ipswich were lucky to score first as often as they did in their penultimate EPL season and their inflated finishing position of fifth was more of a mid to lower half team who got lucky,than a bona fide 5th place finish.A fact confirmed by their relegation the following season.
A Team's Likelihood of Scoring a Game's Opening Goal Compared to their Actual Record.2008-11.
As we can see within just 38 games there is considerably variation between a team's most likely rate for opening the scoring and their actually real life figures.Chelsea dropped over 30% below the figure you would have expected for a team of their ability in 2010/11.They weren't quite the side they had been in the previous two seasons,but by failing to score first in just under half of their games,they saw their points per game total fall below 2.They were closer to 4th than they were to 1st.In short Chelsea partly through luck found themselves trailing more often than previously and because "luck" has no obligation to immediately compensate them once the goal had been scored,they almost finished 4th.So far this year they've enjoyed the kind of scoring record more akin to their ability,netting the first goal 70% of the time one has been scored and are gaining 2 points per game,although sample size is an obvious caveat.
The sample size issue is also illustrated if we combine the three season records of the original Big Four,Liverpool,Chelsea,ManUtd and Arsenal to produce a sample equivalent of 12 seasons.If Chelsea were unlucky when it came to awakening the vidiprinter last year,fortune smiled on United in 2008/09 when they pipped Liverpool by 4 points.However,overall the Big Four combined for the last 3 seasons were expected to score 69% of first goals in non goalless games and that's just what happened.
Spurs were possibly fortunate to grab their Champions League spot in 2009/10.Random acts of elevated 1st goal scoring gave them a similar actual first goal percentage to rivals Liverpool despite Spurs arguably being inferior to the Reds.Second city rivals,Man City were probably as good a side as Spurs,but unlike them they underperformed in the 1st goal stakes.Tottenham grabbed the last Champions League spot by 3 points.
If luck plays a part in deciding the title,it can have much more serious consequences around the foot of the table.As Ipswich discovered,if your base talent isn't as high as you think,a few bad or simply neutral bounces can see you relegated from a previous position of apparent strength.Newcastle and WBA have been relegated in seasons where they could have reasonably expected to score first more frequently than they did,they were probably better than their points haul indicated and both maintained enough quality to return to the top flight.The same could well be true at West Ham.
Alarm bells should have been ringing pre season at Blackburn,who scored the opener in 54% of games in 2010/11 compared to an expectation of 45%.There is of course no guarantee that they won't get close to last year's figure this term,but the likelihood is that with little change in squad quality they will trend towards a lower percentage and find themselves at risk of relegation.So far this season they have just over 0.5 points per game and have scored the opener in only 27% of games.Opening scoring percentage correlates very well with points per game and a scoring % of 36 or below over a season puts a team on or below the magic 40 points mark that separates the EPL survivors from the dispossessed.
Graph of Points per Game verses Frequency of which a Team Scores the First Goal.

A team's opening goal record does not define a season,but it can hide frailties or abilities that reveal themselves in subsequent seasons.Ipswich should have toasted their 5th spot,but prepared for the next campaign as though they had finished 15th.When team management comes to decide how much squad strengthening is needed to maintain standards or push on to greater things,a quick look at the previous year's table is rarely sufficient.
 |
| Hajduk Split kick off against Stoke. |
An example is probably in order.If a team would expect,on average to score 2 goals and concede 0.8 goals in a match or score 71.4% of the goals,it will also score about 71.4% of the opening goals in that matchup where a goal occurs.
Therefore we can say that scoring the first goal is a talent based skill,but the case of San Marino and England also indicates that short term outcomes and insufficiently large sample sizes can lead to less likely streaks appearing.If we imagine for a minute that the EPL is a coin flip league with no home advantage and each team has a 50% chance of scoring first in all 38 games.If we simulate 38 coin tosses and repeat it 20 times for each EPL team we would quickly find a team that appeared to score first much more frequently than 50%.But as we've used the same "coin" for each sequence we couldn't have found a team who specialised in scoring the opening goal,we've just hit an unusual sequence partly through a team's skill and partly through pure chance.Of course the EPL isn't a coin flip league,but it is still prone to short term streaks being mistaken for long term trends.
If we use pre game goals expectations to calculate the proportion of first goals the EPL teams were expected to score over a season and realise that 38 games are likely to produce sequences of games that have been more heavily influenced by good fortune that others,we can start to see which teams may have occupied false finishing positions in the final table.We saw here that it was likely that Ipswich were lucky to score first as often as they did in their penultimate EPL season and their inflated finishing position of fifth was more of a mid to lower half team who got lucky,than a bona fide 5th place finish.A fact confirmed by their relegation the following season.
A Team's Likelihood of Scoring a Game's Opening Goal Compared to their Actual Record.2008-11.
| TEAM. | SEASON. | % of Games where the Team Scored First. | Predicted First Goal Scoring %. | % Over Achievement. | Points per Game. |
| Arsenal | 2008/09 | 64 | 67 | -5.3 | 1.89 |
| Arsenal | 2009/10 | 69 | 69 | 0.7 | 1.97 |
| Arsenal | 2010/11 | 63 | 67 | -6.6 | 1.79 |
| AVilla | 2008/09 | 49 | 57 | -17.5 | 1.63 |
| AVilla | 2009/10 | 62 | 58 | 6.1 | 1.68 |
| AVilla | 2010/11 | 56 | 51 | 8.2 | 1.26 |
| Blackburn | 2008/09 | 39 | 47 | -19.3 | 1.08 |
| Blackburn | 2009/10 | 42 | 46 | -9.8 | 1.32 |
| Blackburn | 2010/11 | 54 | 45 | 17.1 | 1.13 |
| Bolton | 2008/09 | 44 | 44 | 0.3 | 1.08 |
| Bolton | 2009/10 | 47 | 44 | 6.8 | 1.03 |
| Bolton | 2010/11 | 46 | 46 | -0.1 | 1.21 |
| Chelsea | 2008/09 | 74 | 72 | 2.1 | 2.18 |
| Chelsea | 2009/10 | 76 | 74 | 2.2 | 2.26 |
| Chelsea | 2010/11 | 53 | 70 | -32.6 | 1.87 |
| Everton | 2008/09 | 61 | 53 | 12.5 | 1.66 |
| Everton | 2009/10 | 56 | 56 | -0.8 | 1.61 |
| Everton | 2010/11 | 47 | 56 | -18.6 | 1.42 |
| Fulham | 2008/09 | 53 | 46 | 13.8 | 1.39 |
| Fulham | 2009/10 | 36 | 45 | -23.8 | 1.21 |
| Fulham | 2010/11 | 49 | 48 | 1.0 | 1.29 |
| Hull | 2008/09 | 31 | 42 | -37.6 | 0.92 |
| Hull | 2009/10 | 33 | 39 | -17.1 | 0.79 |
| Liverpool | 2008/09 | 67 | 69 | -3.4 | 2.26 |
| Liverpool | 2009/10 | 70 | 69 | 1.0 | 1.66 |
| Liverpool | 2010/11 | 65 | 62 | 4.4 | 1.53 |
| ManUtd | 2008/09 | 83 | 72 | 13.1 | 2.37 |
| ManUtd | 2009/10 | 68 | 71 | -5.1 | 2.24 |
| ManUtd | 2010/11 | 76 | 70 | 8.4 | 2.11 |
| ManCity | 2008/09 | 58 | 54 | 6.7 | 1.32 |
| ManCity | 2009/10 | 49 | 62 | -27.7 | 1.76 |
| ManCity | 2010/11 | 74 | 66 | 10.2 | 1.87 |
| Middlesbro' | 2008/09 | 44 | 45 | -2.0 | 0.84 |
| Newcastle | 2008/09 | 29 | 46 | -56.5 | 0.89 |
| Newcastle | 2010/11 | 51 | 48 | 6.7 | 1.21 |
| Portsmouth | 2008/09 | 41 | 48 | -16.6 | 1.08 |
| Portsmouth | 2009/10 | 26 | 40 | -55.4 | 0.74 |
| Stoke | 2008/09 | 44 | 38 | 13.9 | 1.18 |
| Stoke | 2009/10 | 59 | 44 | 25.9 | 1.24 |
| Stoke | 2010/11 | 38 | 46 | -21.6 | 1.21 |
| Sunderland | 2008/09 | 50 | 45 | 10.0 | 0.95 |
| Sunderland | 2009/10 | 53 | 46 | 12.9 | 1.16 |
| Sunderland | 2010/11 | 50 | 47 | 6.0 | 1.24 |
| Spurs | 2008/09 | 45 | 54 | -18.8 | 1.34 |
| Spurs | 2009/10 | 69 | 63 | 8.2 | 1.84 |
| Spurs | 2010/11 | 44 | 59 | -33.7 | 1.63 |
| WBA | 2008/09 | 29 | 40 | -40.1 | 0.84 |
| WBA | 2010/11 | 32 | 46 | -45.6 | 1.24 |
| WHU | 2008/09 | 50 | 46 | 8.0 | 1.34 |
| WHU | 2009/10 | 40 | 46 | -15.1 | 0.92 |
| WHU | 2010/11 | 39 | 44 | -13.2 | 0.87 |
| Wigan | 2008/09 | 47 | 47 | -0.2 | 1.18 |
| Wigan | 2009/10 | 47 | 45 | 4.7 | 0.95 |
| Wigan | 2010/11 | 37 | 41 | -10.4 | 1.11 |
As we can see within just 38 games there is considerably variation between a team's most likely rate for opening the scoring and their actually real life figures.Chelsea dropped over 30% below the figure you would have expected for a team of their ability in 2010/11.They weren't quite the side they had been in the previous two seasons,but by failing to score first in just under half of their games,they saw their points per game total fall below 2.They were closer to 4th than they were to 1st.In short Chelsea partly through luck found themselves trailing more often than previously and because "luck" has no obligation to immediately compensate them once the goal had been scored,they almost finished 4th.So far this year they've enjoyed the kind of scoring record more akin to their ability,netting the first goal 70% of the time one has been scored and are gaining 2 points per game,although sample size is an obvious caveat.
The sample size issue is also illustrated if we combine the three season records of the original Big Four,Liverpool,Chelsea,ManUtd and Arsenal to produce a sample equivalent of 12 seasons.If Chelsea were unlucky when it came to awakening the vidiprinter last year,fortune smiled on United in 2008/09 when they pipped Liverpool by 4 points.However,overall the Big Four combined for the last 3 seasons were expected to score 69% of first goals in non goalless games and that's just what happened.
Spurs were possibly fortunate to grab their Champions League spot in 2009/10.Random acts of elevated 1st goal scoring gave them a similar actual first goal percentage to rivals Liverpool despite Spurs arguably being inferior to the Reds.Second city rivals,Man City were probably as good a side as Spurs,but unlike them they underperformed in the 1st goal stakes.Tottenham grabbed the last Champions League spot by 3 points.
If luck plays a part in deciding the title,it can have much more serious consequences around the foot of the table.As Ipswich discovered,if your base talent isn't as high as you think,a few bad or simply neutral bounces can see you relegated from a previous position of apparent strength.Newcastle and WBA have been relegated in seasons where they could have reasonably expected to score first more frequently than they did,they were probably better than their points haul indicated and both maintained enough quality to return to the top flight.The same could well be true at West Ham.
Alarm bells should have been ringing pre season at Blackburn,who scored the opener in 54% of games in 2010/11 compared to an expectation of 45%.There is of course no guarantee that they won't get close to last year's figure this term,but the likelihood is that with little change in squad quality they will trend towards a lower percentage and find themselves at risk of relegation.So far this season they have just over 0.5 points per game and have scored the opener in only 27% of games.Opening scoring percentage correlates very well with points per game and a scoring % of 36 or below over a season puts a team on or below the magic 40 points mark that separates the EPL survivors from the dispossessed.
Graph of Points per Game verses Frequency of which a Team Scores the First Goal.

A team's opening goal record does not define a season,but it can hide frailties or abilities that reveal themselves in subsequent seasons.Ipswich should have toasted their 5th spot,but prepared for the next campaign as though they had finished 15th.When team management comes to decide how much squad strengthening is needed to maintain standards or push on to greater things,a quick look at the previous year's table is rarely sufficient.
Subscribe to:
Posts (Atom)