Pages

Monday 26 December 2016

Palace's Pre Christmas Expected Goals Breakdown.

This time last year, Palace were 6th in the Premier League and the Europa League was being touted as a legitimate aim. 

This time around they're 17th and have embarked upon Sam Allardyce's return to domestic football after his unbeaten reign as England manager.

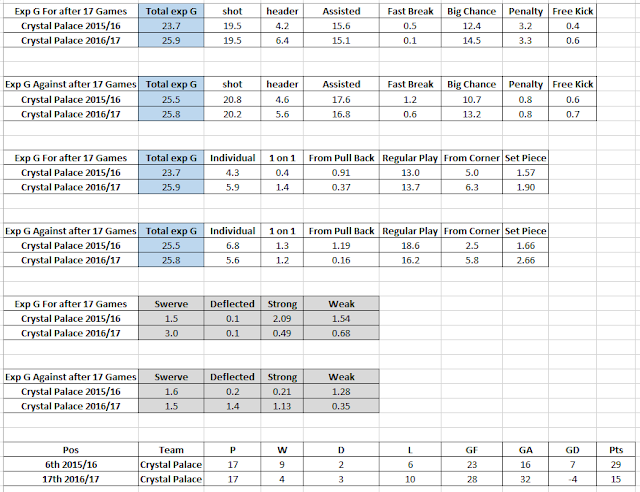
                   Palace's ExpG Breakdown for their First 17 Games in 2015/16 and 2016/17.


Some small sample sized bulges have appeared in the way they've dealt with corners and set pieces and the post kick quality of the shots or headers (in grey) have been less kind in 2016/17 than they were in 2015/16, but overall the cumulative expected goals are broadly similar for both periods.

Randomness partly made Pardew a hero in 2015/16 and unemployed a year later. 

Tuesday 13 December 2016

Blocks Away.

I've written before about a side's ability to block shots, the latest post was here and Burnley's large number of blocks in the Premier League to date has attracted the attention of Twitter.

Blocked shots may be examined in the same way that expected goals may be calculated from modelled historical data.

I have used Opta data that is the raw building block to power Timeform's InfogoApp to model the expected blocks a side may make based on a variety of variables, most notably how central a shot or header is taken from.

The model was built using data from previous seasons and used to predict blocks in the 2016/17 season to date. It adequately passed a variety of goodness of fit tests on the out of sample data.

I have looked at both the number of goal attempts that are blocked by a side, as well as the number of their own attempts that are blocked. So each side has been examined from an attacking and defensive viewpoint.

             Expected and actual Blocks in the 2016/17 Premier League After Matchday 13.


As you'd expect teams either over or under perform compared to the most likely number of blocks based on an average team model.

After 13 games, Liverpool had 78 of their own shots blocked compared to an expected baseline of 73. An under performance, but not really suggestive of anything other than simple variance.

It's slightly less easy to dismiss Sunderland's 48 blocked shots compared to an expected value of just 33. The chances that an average team takes Sunderland's attempts and sees at least 48 of them blocked is less than 1 in 200.


A simulation of all of Sunderland's goal attempts to week 13 produces the above distribution and likelihood of those attempts being blocked. Sunderland's actual block count or above can just be seen at the extreme right of the plot.

On the defensive side of the ball, the Puliser Prize for blocking in the face of adversity, surprisingly doesn't go to his current side, WBA, but Everton.


58 blocks compared to a tactically neutral expectation of just 45 and a 1 in 100 likelihood, hints at some degree of intent.

And Burnley, as they home in on a ton? 89 is a lot, but compared to an expectation of 80, it is their hospitality in allowing teams to shoot that has raised the bar as much as a tactically adepted blocking scheme.

An average side would equal or better 89 blocks after 13 games, given the shots allowed around 14% of the time.

Friday 9 December 2016

Does Save Percentage Tell You Anything About A Keeper?

Back in the late 90's, on Usenet and a floppy disk enabled IBM Thinkpad, beyond the reach of the even the Wayback Machine, football stats were taking a giant lurch forward.

Where there had once been only goals, shots and saves had arrived.

Now, not only could we build multiple regression models where many of the predictor variables were highly correlated, we could also look at conversion rates for strikers and save rates for keepers.

In an era when the short term ruled, a keeper such as David Seaman was world class in terms of save percentage until he conceded more goals in a game at Derby than he had conceded in the previous five Premier League games. And then, as now, MotD's expecterts went to town on a singular performance.

Sample size and random variation wasn't high on the list of football related topics in 1997, but it was apparent to some that what you saw in terms of save percentage might not be what you'd get in the future.

You needed a bigger sample size of shots faced by a keeper and you also needed to regress that rate towards the league average.

This didn't turn save percentage into a killer stat, but it did make the curse of the streaky 90% save percentage more understandable when it inevitably tanked to more mundane levels.

 Spot the interloper from the future.

Fast forward and now model based keeper analysis can extend to shot type, location and even include those devilish deflections that confound the best.

However, for some, save percentage remains the most accessible way to convey information about a particular keeper.

This week was a good example.

It may not be a cutting edge approach to evaluating a keeper, but for many, if not most, it is as deep as they wish to delve.

So what 1990's rules of thumb can be applied to the basic save currency of the current crop of keepers,

We know that the save percentages of this season's keepers is not the product of equally talented keepers facing equally difficult shots because the spread of the save percentages of each keeper is wider than if this was the case.

Equally, random variation is one component of the observed save percentages and small sample sizes are prone to producing extremes simple by chance.

If you want a keeper's raw save percentage to better reflect what may occur in the future regress his actual percentage in line with the following table.


Stoke's (or rather Derby's) Lee Grant has faced 31 shots on goal and saved 26 and his raw efficiency is 0.839. League average is running at 0.66.

Regress his actual rate by 70% as he's faced around 30 goal attempts, so (0.839 *(1-0.7)) + (0.7 * 0.66) = 0.713

Your better guess of Grant's immediate future, based on his single season to date is that his 0.839 save percentage from 31 shots may see him save 71% of the shots he faces, without any age related decline factored in.

He's still ranked first this season, but he's really close to a scrum of other keepers with similarly regressed rates. Ranking players instead of discussing the actual numbers is often strawman territory, anyway.

There's nothing wrong with using simple data, but you owe it to your article and audience to do the best with that data.

Raw save rates from one season are better predictors of actual save rates in the following season in just 30% of examples. 70% of the time your get a more accurate validation of your conclusion through your closeness to future events if you go the extra yard and regress the raw data.

At least Party Like it's 2016, not 1999.

Wednesday 30 November 2016

Was Aguero Quite So Lucky in 2015/16?

By now, expected goals needs very little introduction.

It attempts to quantify the importance of pre-shot variables in determining the likelihood that a goal will be scored. In essence it is a measure of chance quality and is largely determined by such things as shot type and location.

The majority of models output the likelihood that an average Premier League player would score from a given position and shot type. By aggregating the individual expected goals for each attempt and comparing this to a player's actual output we can broadly suggest the level of under or over performance.

Here's how the two 2015/16 leading non penalty scorers fared compared to the aggregated total of their expected goals,


Both over-performed,

Aguero more so than Kane, but we can better visualise this disconnect by simulating each of the 111 non penalty attempts taken by Aguero to see the range of season long goal totals predicted by the model.


There's around an 8% chance that the average player model would equal or better Aguero's 20 non penalty goals from his 111 chances in 2015/16.

Thereafter the interpretation becomes more subjective.

We may assume presumptuously that the model is perfect and Aguero was merely lucky.

281 individual players tried to score in 2015/16, so that's alot of individual trials and someone is likely to over perform to the level that Aguero did.

This suggests that he may subsequently enjoy more normal levels of luck and his performance may be less extreme in the future.

Or we might prefer that Aguero's 20 goals is partly driven by luck, but it also contains an element of skill in finishing chances that exceeds that granted to the average player whose out of sample data went into producing the model.

As suggested by the title of the above graph, we can produce a second expected goals model that while not explicitly tailored to Aguero's (potential) finishing prowess, does contain elements that may act as a proxy for elusive finishing ability.


If we now simulate Aguero's 111 chances, but using a model that incorporates statistically significant variables that "may" relate to finishing skill, he becomes less "lucky". His 20 goals are now much less unlikely. The new model predicts he would score 20 or more in nearly 40% of seasons.

Overall, this new set of variables (I can't be more specific, sorry) inflates the individual expected goals values of players, such as Aguero and Kane who possess the new variable and reduces the the figures for those who don't.

Overall a model that allows for a differential in finishing abilities across all players that attempt to score in a typical season reduces such indicators as the rmse in out of sample data.


Under a model that includes a proxy term for finishing skill, Aguero only scores 1 more goal than predicted in out of sample data from 2015/16 and Kane scores exactly the number predicted by the model.

Perhaps more importantly Aguero's 2015/16 is a substantially better goodness of fit at the individual attempt level under the second model compared to the first.

Tuesday 22 November 2016

Burnley's Unsustainable Survival Technique.

Monday night's live game pitted two of the Premier League's more dour sides against each other.

WBA is the magnificent Tony Pulis' current port of call, where they are the recipients of his exclusive brand of pundit flummoxing, survival techniques.

Meanwhile, Burnley are getting by on a meagre 0.8 expected goals per game. They are conceding an average of 2.1 expected goals per game and through the grace of the probabilistic gods, actually allowing just 1.4 real goals.

That's not a Pulis approved survival approach, at least in the long term, but it has given Sean Dyche's side a few notable results.

Top of the tree of upsets was Burnley's 2-0 early season win at home to Liverpool, where Dyche tired out his opponents, not by engaging them in a presssing foot race, but by nicking an early lead and then handing them dozens of goal attempts.

All of which they missed.


The blueprint of being overwhelmed, but showcasing the England credentials of your defence, was wheeled out again at Old Trafford for the approval of Jose. And while Burnley didn't quite manage to nick a goal here, they did keep their goal intact for a welcome point.


Sandwiched in between was another expected goals beating at the hands of a top six contender where the reality better reflected the distribution of the quality and quantity of chances created in the game.

Chelsea's invite left Burnley nursing a 3-0 loss.


On the surface Burnley had made a comfortable start to their renewed acquaintance with the Premier League. "they look far better equipped for survival this time around, sitting comfortably in 9th place"  might have been something that was written about the Clarets prior to Monday's game.

But scratch beneath the media soundbites and Burnley's well being is supported by a large helping of unsustainable variance.

Hats off to the 14 Burnley players who withstood the battering from an 11 and then ten man Manchester United in late October, but simulate the exercise 1,000's of times and a United win is by far the most likely outcome of the three possible results.

Simulate all 120 matches, along with the multitude of possible tables, 1,000's of times and Burnley's most likely current position is.....bottom. Rather than the more comfortable 9th they occupied prior to match week 12.


Of course, points already won are kept, no matter how ill gotten or deserving and should Burnley continue their idiosyncratic survival process, coupled with their recent showing in the Championship, they probably won't finish in their current expected position of bottom in May.

They'll most probably finish 19th.

If you want to check out all of Burnley's shot maps, along with all Premier League games for the last three seasons, download the free Infogol app 

Friday 28 October 2016

The Addenbrooke to Zenga of Wolverhampton Wanderers.

It will be scant consolation to the recently dismissed Wolves manager, Walter Zenga, that managerial tenure has shown a decline over time and not only in the currently trigger happy East and West Midlands.

Wolves' first paid committee manager, Jack Addenbroke lasted an impressive 37 years, spanning the Victorian age and one World War.

But even if we begin at the start of the last old Golden Age with the appointment of Bill McGarry in the late 60's, time served by the boss has shown a downward trend.

McGarry's 398 games in charge during his first stint at the club was ended by relegation from the top tier after a May Monday night defeat at Molineux by Liverpool.

The maths were simple, a win for the hosts secured their First Division lives, while a win for the visitors won them the title. High drama that TV would die for, but in the 70's only radio put in an appearance to see a future Wolves captain lift the silverware for Liverpool.

Defeat sent Wolves on a footballing journey that only fleeting returned them to the top table.

Part of Wolves' Magical Mystery Tour post 1976. Blogger laughing because he's marking a goalkeeper!

At the dawn of footballing time, managers were lasting on average for around 150 matches, now it's down to about 50.

Success rate obviously plays a part in perceived managerial talent and Zenga's so so 47% success rate would typically entitle him to at least a season of honest toil, rather than the 17 matches he was actually granted.

His last game in charge perhaps sums up the knee jerk reactions prevalent today.


In keeping with 10 of the 14 league games contested by Wolves this term, their process created the better chances compared to their opponents.

In Zenga's final game in charge, typically a side would win slightly more times than they drew or lost were they have created 2.33 expected goals to 1.51 for their opponent

But not for the first time (7th April 1973), Leeds gained an undeserved 1-0 win.

Over Zenga's 14 league games, Wolves have a positive expected goals differential of 3.5 goals, rather than their actual goal difference of -1.

They've lost in three matches where they have been the superior expected goals team, drawing a further three in similar circumstances.

Their most likely current position based on process, without the sometimes perverse intervention of small sample sized randomness, is inside the Championship top ten rather than the current 18th spot that has played a part in Zenga's dismissal.

Even with their current lowly status, a more neutral division of shot outcomes over the remainder of the season places Wolves most likely finishing position at mid table........but in keeping with today's "enlightened" footballing age, the current small sample derived pecking order has already had a big say.

Spurious correlation. There is a medium to strong correlation between the first letter of a Wolves manager's surname and his tenure, and hence his success....so Big Sam A it is!

Saturday 15 October 2016

Once Upon a Time in the Midlands

Time was when an international break simply meant a manager spending an anxious couple of days waiting for injury reports to materialise and trying to keep the left behind players amused.

Now it seems to have become the prime firing time and just under half of the 2016/17 casualties from the four top English leagues have departed during the current hiatus.

Two of the higher profile dismissals have come across the east/west Midlands divide, with RdM being stood down for Steve Bruce at Villa and Steve McClaren reacquainting himself with Derby at the expense of Nigel Pearson.

Both sides are currently treading water just above the drop zone, respectively in 20th and 21st position and it's difficult not to speculate that current league position has played at least as big a part in the managerial changes as has a fear of drones.

Using drones may take spying on your employees to new heights, but it is equally questionable as to whether the league table ever gives a true representation of a team's true worth or if it is indeed the table of (in)justice.

Beware of Low Flying Drones.
Both Derby and Villa have a negative goal differential after 11 matches, but this isn't reflected in their respective expected goals figures for all the chances created in their games.

Derby's return of six goals is a poor one for a side that has created chances worth nearly twice that and the randomness that is inherent in short runs of matches has been less than kind to Villa, particularly in how it has bestowed goals in games and regularly turned three points into one late in their matches.

An extra couple of points this early in the season can easily turn anxious glances looking downwards into optimistic ones looking upwards to better things.

Both Derby and Villa are in the top half of the table when measured in terms of the underlying performance indicators that tend to persist amongst the ebb and flow of randomness that sometimes predominates, getting managers sacked or manager of the month awards, dependent upon whim.

Longer term, weighted expected goals performances smile even more on Derby, regular play off contenders, who are ranked around the top six in the current crop of Championship teams.

While Villa, despite giving the 2007/08 Derby vintage a run for their money with an abject defence of their Premier League life last season, still remain a top half Championship ranked side.

Final league projections at their most optimistic propel Villa to the fringes on playoff football, even without fully accounting for the potential impact of their new crop of expensive attacking talent, a relative luxury Bruce has never had before. And Derby fare even better, even with their miserly actual points return through 11 matches.

Fan reaction to the appointments is cautiously optimistic.

Derby fans in particular citing McClaren's ability to "improve a player", the unwelcome distraction of Newcastle potentially calling during his first stint and the example from the Stoke end of the A50 of returning managers taking their team to the top flight.

Should the fortunes of these two Midlands sides improve, this wishful impact of managerial change will appear to materialise, but it will be scant consolation to the replaced duo that the underlying figures were largely in place and the table may have become merely a tad less untrustworthy in their absence.

Saturday 8 October 2016

Expected Goals Distribution in the Championship.

Everyone is familiar by now with the concept of expected goals.

The challenge is to present team figures in a way that demonstrates the granular nuances that are often lost by merely quoting totals or differentials.

It has also been accepted that how a sides expected goals is spread over their chances also impacts on the results they achieve. A side that takes lots of low quality shots compared to fewer, better quality opportunities is trading the chances of  an occasional headline grabbing goal glut for a more regular diet of lower scores.

The latter being preferable in a low scoring sport such as football.

A cumulative expected goals figure lacks granular data, while a full blown, chance by chance simulation reveals more, but is time consuming unless automated.

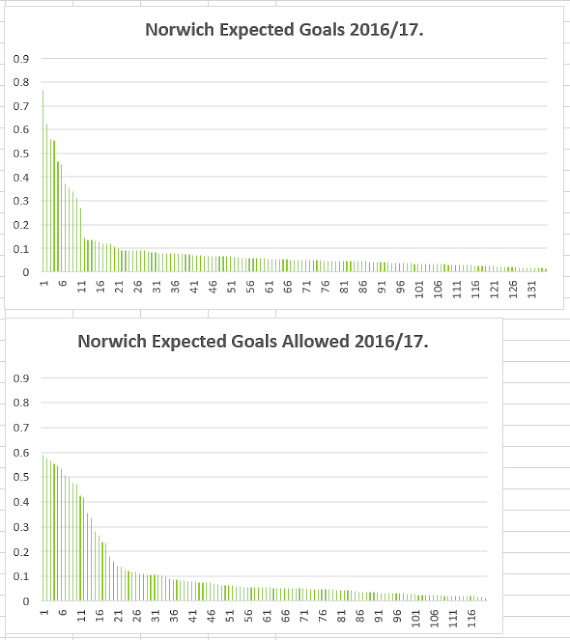
A decent halfway house is to plot the expected goals figures for each non penalty chance created and faced by a side over the season to date.

Scaled appropriately, the fatness of the left hand side of the plot shows the level of high quality chances a team has faced or made, while the length of the x axis illustrates chance volume.


Here's Newcastle, 11 games into their Championship season, out chancing their opponents with a long x axis and bulking up on good quality chances, while denying opponents the same luxury.

The highest quality non penalty chance they have conceded has a goal expectation of just over 0.4.


It's less rosy over 11 matches for fellow relegated side, Norwich who have allowed opponents a decent number of good quality chances and leaders Huddersfield currently profile more like a mid table team, such as Wolves.


At the bottom, Rotherham are currently being swamped by shot volume of fairly high quality, while offering little in return.


Friday 30 September 2016

The Biggest Liar in Football.

In a week during which many fresh contenders emerged, the league table remains one of the least trustworthy sources in football.

2-0 leads being the "most dangerous in football" made a welcome reappearance courtesy of James Richardson on the BT European Goals Show and was warmly greeted by the assembled hacks, but "the table never lies" still reigns supreme.

Small sample size, luck laden outcomes, random variation, strength of schedule, red cards, injury counts, new improved/useless players and managers, dodgy, but well intentioned interpretation of the laws, patchily applied, all conspire to produce a transient ranking that broadly sifts the very best from the very worst, but rarely manages to fully reward the bulk of closely matched sides with their just deserts.


Reinterpreting the mass of shots, saves and passes into a better reflection of the past and a less knee jerk projection of the future can be done by simulation of past and future games to generate the now familiar heat maps. These show the range of points a side might have/may well accumulate and the range of potential positions occupied.

This approach admirably illustrates the probabilistic breadth of outcomes that can befall a side given their core achievements, but nothing beats the implied certainty of a singular league position, with as much of the unsustainable luck stripped away.

The backbone of the table above, produced by Tom @UTVilla is the current position occupied by the team in the Premier League.

The expected position to the left is the most likely position occupied by each side based on an expected goals simulation of each match played in the season to date. So Hull are flattered somewhat by their current position, while Stoke should perhaps be a couple of places higher.

The right hand axis uses the actual number of points, ill gotten or otherwise and adds the simulated outcome of each team's remaining fixtures based on their core statistical achievements over the recent past. It includes the season to date, but not exclusively so.

This forecast position grants teams the luck they have enjoyed or endured to date, but denies them the extremes in the up coming months.

Tom's tube map to each side's ultimate potential May destination brilliantly illustrates the likely upwardly mobile or downward spiralling trajectories which may await...except possibly for Pep's Manchester City revolution.


The more mature Championship table, with four more sides compared to the Premier League and six new entries each season perhaps offers a more interesting chart and La Liga completes this initial trio of leagues.


Thursday 22 September 2016

Expected Goals and Game State.

The aim in competitive team sports is to score more goals or points than you allow your opponents.

However, often the route taken is subtly compromised by the ultimate intention of simply winning the contest and scores are neither maximised. nor scores allowed minimised.

More so in higher scoring sports, such as American Football, a side will react to the efforts of a trailing team by allowing yardage and possibly points to be scored against themselves in exchange for the trade of another valuable commodity, namely time run off the clock.

In short, team's react to the current score or game state and the multitude of statistics generated in this phase of a match may not be a true representation of the gulf in quality between the teams in a more equally balanced phase.

"Garbage time" touchdowns when already trailing by four scores may alter our assessment of the abilities of two teams in a more favourable way for the defeated side.

Therefore, it is commonplace to assess an NFL team based on the numbers they record when within one score either side of a tied game and further restrict collection to include pass/run neutral downs and distance, such as 1st and 10.

Football has fewer scoring events than its Stateside cousin, but game state and performance, particularly if measured in expected goals, may benefit by dicing the data to similarly include events that occur within one score of a tied scoreline.


Stoke have made an uncomfortable start to the season where conventional wisdom saw them as capable of taking the next step as a regular top ten and potential top six side.

Instead a run of actual results that more typically reflect their core expected goals figures from the latter half of 2015/16 finds them bottom with a single point.

Last Sunday's match at Crystal Palace highlight's how game state may produce expected goals figures that might not fully reflect the relative team merits.

Stoke shaded Palace in expected goals, but Palace scored four without reply until injury time.

In the admittedly brief period during which the game was level or within a single score, the home team had four attempts to none from City.

Just under half of Stoke's goal attempts and 65% of their total accumulated expected goals came in the final 15 minutes, when the hosts already led 4-0.

"Give Me Hope, Joe Allen"
Perhaps Palace considered conceding four in the final 15 minutes to a team who had failed to score at all in the first 75 was so unlikely they could coast to full time with little risk, save for a narrowing of the virtual divide and the odd real life goal conceded.

Maybe they slipped into the Premier League equivalent of a prevent defence, but few would argue that Stoke's expected goals "victory" over the 90 minutes hid a miscarriage of justice.

Palace out "expected goaled" Stoke with the scores level, when up by one, when up by two and when up by three. Whereas Stoke only dominated when the match was over as a recognisable contest.


With this in mind, here's the ranking of the expected goal difference for all 20 sides in the Premier League for all 2016/17 games and corrected for strength of schedule. Both with the game close and then for whole game data.

     Ranked Expected Goal Difference in All Matches and while Games are Close, 2016/17.


Liverpool have the best expected goal difference counting every minute played this season, but current leaders, Manchester City have been the most dominant in terms of expected goals created and allowed whilst their matches have been at their most contestable.

Friday 16 September 2016

Goalkeeping Talent and/or Luck

Whether you are making a subjective or data based assessment of the skill sets of footballers the approach is similar in both cases.

Has the player out performed a nominally chosen benchmark figure for the attribute you are measuring.

For example, if a keeper makes saves that an experienced observer considers exceptional or if he saves more attempts than expected by a statistical model based on the average performance of his peers.

The limitations of such observational based evaluation lies in sample sizes. Keepers may produce hot performances that inevitably cool and aren't indicative of the general level of performance and levels of good or bad fortune may be present in any data set.

I've 67 on target attempts faced by Fraser Forster in 2015/16, he conceded 17 goals and simulating these shots faced can show how often an average keeper, represented by an expected goals model, would have conceded as many or fewer than Forster did that season.


Forster's 17 goals conceded is equalled or bettered by an average keeper in around 24% of trials and is represented by the orange part of the distribution.

While an over achievement is obviously desirable, simulating all attempts also adds information about how likely it was this over achievement occurred by chance. Forster may not maintain these levels, but he may be a consistently above average shot stopper.

The table below uses shot data from 2015/16 to see how often an "average keeper" simulation of the actual attempts faced by Premier League keepers resulted in the par keeper equalling or bettering the actual number of goals conceded in reality by each keeper.


Only 11% of simulations managed to equal or best Fabianski, whereas at the opposite end of the table Stoke's keeper crisis in the continued injury absence of Jack Butland is starkly revealed.

Their current first choice keeper is 40 year old Shay Given, who is unsurprisingly injury prone and his performance in limited appearances last season was equalled or bettered by 80% of average Premier League goal keeping prowess.

Jakob Haugaard, his younger and initially preferred counterpart, raises that under performance to include every average keeping simulation.

Haugaard conceded 9 goals from 18 on target attempts against a cumulative expectation of just over three and I've yet to find an iteration of those 18 attempts that does worse than the young Danes' unimpressive introduction to Premier League duty.

Shot saving is off course one of many abilities demanded of goalkeepers by modern day managers, but it remains a substantial contributing factor to their valuation and age is also a factor. Even keepers have ageing curves, albeit right shifted compared to the overall footballing sample.

These two simple inputs of age and likelihood of over performance from last season broadly correlate to each keepers current valuation on Transfermarkt.

Courtois and de Gea's valuations, rightly or wrongly have made the jump to vie with the inflated valuations of mainstream attacking players, but the input of the two variables listed above generally identifies those who command a high price amongst their peers (even if their over performance is likely to regress) and those who risk being replaced by a loan signing from the Championship (even if their parlous under performance is also likely to become less extreme).

Thursday 15 September 2016

The Championship After 7 Games.

The English second tier makes good use of the early season midweek to cram in as many matches as possible. Already teams have played nearly twice as many league matches as their Premier League counterparts and around 1/8 of the season is already in the record books.

The division is often more chaotic than the Premier League, boasting four additional sides and six new members each year by way of relegation from the top tier and promotion from the third.

So there is potentially a big gulf in class between the strongest teams in the division, represented by Premier League regulars on a brief excursion to pastures new, such as Newcastle and under resourced over achievers with a recent history of non league football, such as Burton.

However, these financial mismatches often mask a bulk of the division where resources and abilities are broadly similar and the difference between a push for the playoffs or an anxious spring spent looking downwards can be as much down to the vagaries of luck as it is to the careful assembly of talent.

In the tables below, I've simulated the remainder of the season, based largely on a weighted combination of each team's expected goals created and allowed so far in 2016/17 and their expected goals performances from the previous season.

The points won in each iteration is then added to the actual points they've won so far to chart the % likelihood that each team will finish in a particular position in May.

                                       Simulated Final League Positions After Seven Games.


The preseason bullishness about the chances of Newcastle returning instantly to the Premier League, not just as a promoted team but as champions, is even more apparent after seven games. they spent the first couple of matches at the foot of the early table, but now have top spot firmly in their sights.

A slow drift in the early market has been reversed and they are a shade of odds on to be crowned champions in May, a sentiment endorsed by the simulations.

Early pacesetters, Huddersfield are most likely to finish in the final playoff spot, but in common with many sides their range of possible finishing positions spans much of the table.  Their accumulated chances make them more likely than not to miss any kind of post season shot a promotion.

Wolves are as likely to finish top as they are to finish bottom, although neither outcome is very likely.

Around a third of the sides are probably looking at a bottom half finish as their most likely final resting place, amongst them newly promoted Burton and premier League and European giants of the past, Leeds and Nottingham Forest.

Of the other relegated teams, Norwich are strongly expected to join Newcastle with an immediate return either automatically or via a playoff attempt, while Villa are posting the kind of position spreads that would have been acceptable to their fans in the Premier League, but not in the lower tier.

Tinges of green hint at the prospect of decent seasons for Brighton, Sheffield Wednesday and Bristol City and less so for Rotherham.

Tuesday 30 August 2016

The 2016 NFL Regular Season Done & Dusted in Excel.

The NFL’s back and so are the LA Rams, so here’s how I'd go about modelling the 2016 season.

Firstly, you need a rating for each team in the new season.

Previous season’s data is always a good starting point, but the NFL is a relatively short 16 games regular season, so wins and losses from 2015 can be heavily influenced by luck or random variation to give it a less provocative name.

Winning lots of games by narrow margins, winning more or fewer games than your points scoring/conceding merits and feeding off lots of turnover ball are usually big indicators that your win/loss record may regress towards the league of 8 wins in the upcoming season.

These traits are often described as "knowing how to win", but they are almost always just random......or possibly cheating.

Based on how teams with these flags against their record did in the subsequent season over the last decade, the Carolina Panthers (15-1) would expect to regress to around 10 wins in 2016. 

The four win Chargers should be dragged upwards to just over 7 wins.

These projections are around where the Panthers and the Chargers are quoted in the season total wins markets. So we’ve got a decent starting point that’s potentially stripped out some of the unsustainable luck that went into the 2015 regular season.


Here's the predicted wins for all 32 teams based on last year's luck based indicators.

Next we need a way to predict individual match results.

The NFL is blessed because we have Bill James’ Pythagorean Log 5 method, which takes winning percentage and home field advantage and spits out the odds of a home and away win. 

(It looks like this =((E2)*(1-G2)*$B$1)/((E2)*(1-G2)*$B$1+(1-E2)*(G2)*(1-$B$1)), where E2 is the home team win%, G2 is the away team win% and B1 is the home winning %, currently around 0.57).

The Panthers are projected as a 10-6 team, so 10/16 or a 0.625 team.

You put estimated win% for each team into each match up and get the estimated home win% for the match as the output.

Do this for every regular season game. 

The projected 0.39 Rams go to the 0.27 SF 49ers on Monday night, week one. 

Last season the Rams were in St Louis and if we stick our regressed, new season win% into Bill’s formula we get LA 1.8 (a shade of odds on) to win on the money line in SF or a spread of around 3 points in LA’s favour.

LA are currently quoted at -2.5 favs, so again, we’ve got a decent model.

Next we need simulate all 256 games from week one to week seventeen.

Again it’s easy in excel. 

We judge that LA will win in SF with a probability of 0.56 based on our money line odds of 1.8 and if we stick a random number between 1 and 0 alongside this estimated win probability and if it falls below 0.56, we grant LA their win, otherwise it’s a SF win.

Again we can do this for every regular season game and we’ve simulated one NFL season for 2016.

Ideally we’d like to repeat this a couple of thousand times and once again even excel obliges in less than a minute with a decent computer.

Check out this soccer post for the basic method.

We now have a range of season wins for all 32 teams, based on a reasonably robust new season rating and their actual intertwined schedule.

Seattle has the best projection in 2016, they are expected to average just over 11 wins.


However, the simulations illustrate the range of outcomes that are possible even for the likely best team in the NFL just due to the randomness in a short 16 game season.

From the plot of the outcomes from 10,000 iterations of the 2016 season, there is an 8% chance that Seattle will not have a winning season. Small, but certainly not insignificant.

More positively, there’s around a 1 in 1,000 chance they go 16-0. Bookies will currently give you around 499/1

It’s around 200/1 that someone goes 16-0 in 2016, again you might get 66/1 on that.

Ratings can be updated as the season progresses or you can add your own tweaks at any time, such as subjective adjustments to account for current rosters.

Finally, here's the finishing probabilities for the NFC West, based on 10,000 league simulations and appropriate tie breakers.


Fairly close to the quoted odds for the top two, with the Rams and 49er's shortened on the books in case either "do a Leicester".

Seattle and Arizona are most likely to also nab the top seeding in the NFC, along with Cinci, New England and Pittsburgh in the AFC. But you could have probably guessed that.

The Jets have about a 14% chance of winning 12 or more games, which might be an AFC outsider worth running with. 


While Dallas and Detroit each has a 5% chance of doing likewise in the NFC and getting a high post season seeding.

Monday 29 August 2016

On The Rebound.

Expected goals are designed to look at the process of scoring, rather than the singular outcome on the day.

I've previously written about how few big chances aren't equivalent to the same expected goals spread over more shots. The later trades the possibility of scoring a larger number of goals for the greater likelihood that you will score at least once.

Another acknowledged problem when using cumulative expected goals to represent a side's achievements is the treatment of quickfire attempts from rebounding shots.

Often the chances are created well inside the box, sometimes leading to cumulative expected goals totals that exceed 1 for a connected opportunity that could at best only result in a single score.

Choosing cutoff points is always subjective, after all every action in a real match is connected to some degree from the first kick to the last, but in the table below I've charted the percentage of shots for each team in last year's La Liga that came within 10 seconds of their previous attempt.

Over 90% of attempts were made at least 30 seconds after the preceding effort, so the majority of attempts are preceded by a lengthy phase of general play.


The average in 2015/16 for La Liga as a whole was 6%, but Eibar, Espanyol and Real Betis heeded the call to "follow up" with greater regularity.

The problem of over estimating a side's attacking potential by inflating rebounds can be reduced by simulating chances, but limiting such sequences to a maximum of just one actual goal scored.

For example, two sequential chances, in quick succession each having a singular probability of being scored of 0.5 doesn't guarantee a goal, on average, as their cumulative total may suggest. Instead you score with three quarters of such related opportunities.

Real Betis hone their blocking skills against a top Premier League team.
We can demonstrate the difference between the two sets of circumstances by accounting for and then ignoring the connected events in a match simulation.

In 2015/16 Eibar drew a late season fixture with Betis, 1-1.

Visitors, Betis had six shots, one of which was the game's biggest chance, from which they scored, nicely illustrating the value of creating the odd gilt edged opportunity.

Eibar had 21 attempts, 16 of which had a goal probability of less than 10%.

Five Eibar attempts came within 10 seconds of an initial attempt. Four combined low value attempts with more valuable ones, but the final salvo united two attempts that were individually marginally odds on to be scored.

Cumulatively, Eibar's expected goals almost reached three compared to just over one for Real Betis.

Although score effects also played a part, the hosts would appear to have been unlucky to not gain three points.

Simulations based on attempts conform this impression.

A straight simulation of all 27 attempts in the game give Eibar more goals in 83% of the iterations, scoring and conceding an average number of goals per game that equals the cumulative expected goals tallies of each attack.

However, once you treat rebounds as connected events, Eibar's share of victories falls to 77% and the average goals scored does likewise from their average cumulative expected goals of 2.9 to just 2.6.

Expected goals do provide insight into a side's ability or achievement in a single match, but occasionally they over or under rate the teams at the extremes.

Friday 26 August 2016

48 Games into the Championship.

The Championship may be only four match days old, but granular data on the state of the teams is beginning to pile up.

Over 1,000 goal attempts have been made, 300 plus of which required the keeper to try to at least make a save and Shane Duffy has already scored three league goals, although none for his actual employers.

Prediction is a constant balancing act between using recent data and larger samples that inevitably contain information from previous seasons, when a side may have had a very different lineup.

Huddersfield currently sit top of the Championship, while Newcastle, the short priced preseason favourites are closer to the relegation zone, from a points perspective than they are to the top of the pile.

The betting markets do not expect this situation to remain and Newcastle still head the market and the current leaders are given around a 4% chance of remaining in their current elevated position.

Fans of Huddersfield will no doubt relish their current position and perhaps dream that they are deserved pacesetters at this early stage, much as Crystal Palace. Swansea, Leicester supporters did in the early 2015/16 Premier league.

So is there any useful information to be gained from a sample size of just four games?

Many will be familiar with the idea that individual matches are rife with luck and looking at the process of chance creation, rather than just the relatively infrequent outcomes can be more predictive.

Huddersfield currently has a goal difference of +3, the smallest possible differential when acquiring 10 points from four matches and they have won each of their three victories by the margin of a single goal.

They've taken just slightly more attempts than they've faced and expected goals, based on shot type and position suggest that they might score, on average 4.5 goals and allow 5.5 from such chances.

They have a negative expected goal difference after four matches, that is only the 16th best record this season.

Small numbers of matches can also have very different strengths of schedules for different sides and Huddersfield has played a reasonably taxing first four games against relegated teams, Villa and Newcastle, along with Barnsley and Brentford.

Using interlocking collateral form of all 24 sides and their expected goal differential from Opta sourced data, the solutions that describe the events of the 48 games to date, place Huddersfield as the 12th best team in terms of strength of schedule corrected expected goals.

Newcastle are second under this approach, behind only Brighton.

All three promoted teams are comfortable inside the top 10, along with the likes of Wolves, Fulham, Derby, QPR and perhaps surprisingly, Reading.

Blackburn prop up whichever approach you use, with Nottingham Forest and Birmingham enjoying more elevated league positions than their shooting and schedule perhaps merits.

It's early days for the 24 team league and Huddersfield fans should perhaps screen capture for posterity this early incarnation.

Wednesday 10 August 2016

The Premier League Goalkeeping Class of 2016/17.

Goal scorers, followed by goal keepers have been the most widely analysed positions in football.

The reasons are obvious, their main duties are closely connected. Strikers try the get the ball on target and into the net, whilst keepers do their best to prevent the latter.

In short, there is a readily identifiable series of actions and possible outcomes that can be used to attempt to define the abilities of the two positions.

Initially keepers were ranked simply by save percentage, the proportion of on target attempts that they prevented from turning into goals.

We should expect some variation in save percentages, even if every attempt carried exactly the same difficulty tariff and each keeper had the same talent for making saves.

If you toss a series of fair coins in a varied number of trials, the success rates of heads will largely fall in and around 50%, but some coins will appear more talented than others, just through chance.

Once you allow for this natural variation and  unequal number of attempts faced by the individual keepers, the save percentages of Premier League keepers is still more widely dispersed than though mere chance.

We can conclude that either, some keepers are better at saving shots than others, not all shots are savable to the same degree or much more likely a combination of at least these two factors.

Expected goals models, which use shot location, type, style and placement may be used in an attempt to quantify the task faced by keepers for each individual on target attempt.

A weakly struck chip that drifts gently towards the centre of the goal at midriff height is eminently more savable than a powerfully hit shot that deflects towards the top corner and historical precedence can be used to assign such efforts differing likelihoods of being saved.

This type of analysis quickly yields keepers who have allowed fewer goals than the average keeper described by such models would conceded from the attempts faced.

For example, in 2015/16 Lukasz Fabianski allowed 44 non penalty and non own goals from 157 goal bound attempts compared to an expected number conceded of nearly 50. Similarly, Kasper Schmeichel allowed 32 from 128 attempts against a par score of just over 35.

Both are over performers, but if we look more deeply at each attempt by simulating the range of outcomes using an average stand in keeper, the Swansea stopper appears to have put in a more solidly impressive performance.


An average keeper would emulate or better Fabianski's 2015/16 shot stopping performance around 9% of the time, whereas he would replicate or better Schmeichel's above par season in over a quarter of the simulated trials.

Over performing shot stopping, therefore is an encouraging sign, but by no means a clear indication of consistent, above average talent that may persist. It may just be par ability boosted by luck.


The table above shows the keepers who played in both of the last two seasons and how many times they saved more shots than predicted by an average ability expected goals model.

Ten keepers were above average in both seasons, whereas eight were below par in consecutive campaigns.

Stoke and England's Jack Butland combines youth with two season's of over performance in terms of goals allowed compared to the goal bound efforts he has been required to save.

However, just as Schmeichel's 2015/16 season has a 25% chance of being replicated by a lucky, average keeper, the same is true, only more so for both of Butland's seasons.

His impressive over-performance in 2014/15 from relatively few attempts faced and his smaller over achieving 2015/16 season from a much larger sample size was in both cases replicated or bettered in just under 50% of trials.

Depending upon where we draw this probabilistic line, many of the keepers who have had two most recent above par performing seasons against an expected goals model begin to fall away.

de Gea's most recent season is reproduced in nearly 30% of average trials. Similar reservations apply to Pantilimon, Robles, Forster, Ospina and more marginally Cech.

Only three keepers have over performed in the previous two seasons, with location/style/placement corrected expected goals campaigns that each have a likelihood of 10% or less of being replicated by our average keeper.  

Fabianski has the most impressive combination of dual over performance that is least likely to be emulated by an average performer, followed by Lloris and Adrian.

Conclusions should always be couched in probabilistic terms.

Butland and Forster, the two pretenders to Hart's England shirt may well be above average shot stoppers, but current evidence allows for the not insignificant possibility that both are reasonably capable keepers, who have enjoyed a run of good fortune.

And both may be a step or two behind possibly the best combination of likely longevity and current ability shown in the Premier League by Spurs' Hugo Lloris.