As well as providing the analytics community with a rich vein of raw data, Manchester City is also themselves the subject of many of the sound bite stats that appear on a daily basis. Unsurprisingly for a highly successful side, many of these statistical nuggets of information revolve around goal scoring exploits.
Last month Dzeko was a super sub. But a single strike, accounting for only 20% of the goals scored while he has been on the pitch as a replacement since early November has seen the "super sub" tag largely disappear from print and Dzeko's scoring rate as a late entrant has fallen closer to earth.
Gareth Barry's winning goal against Reading in the 93rd minute of the match appeared to merely reinforce City's apparent ability to score late goals at will and none were more important than the two stoppage time strikes in the final match of last season, when victory over ten man QPR secured the title. From the beginning of the 2011/12 campaign up to and including Saturday's last gasp win over the bottom club, City have scored 24 goals in the 85th minute or later, twice the number of their nearest rivals, United.
Reported in isolation the sound bite stat appears impressive. The narrative is clearly intended to portray City as an incredibly dangerous attacking side late in matches, certainly much more potent than their neighbours. With the backing of data going back over 56 previous matches, we appear to be looking at a cast iron case.
Since 2011/12, City have arguably been the best side in the Premiership, scoring 127 goals over those 56 games. So the first legitimate question is how many goals would such a team expect to score over that run of matches after the 85th minute ?
We can describe each of those games in terms of the initial goal expectancy that City would expect record over numerous repetitions of the 56 games. Goal times appear to be rounded up as two of City's goals, recorded as 85 minute strikes, were scored after 84 minutes and 30 seconds but before the 85th minute was reached. If we allow for the actual amount of "normal" time played, the actual stoppage time played, Manchester City's initial goal expectation in each match and the gradual increase in scoring rate which occurs for all teams as the contest progresses, we can calculate the goal expectation for City for every minute described in the recently circulated "85 minute" stat.
City is a top side and their average goal expectancy per game since August 2011 from the 85 minute and beyond is just over 3 tenths of a goal. Therefore, they would have expected to score 17 goals over that time span and their actual total of 24 is an impressive 40% higher. By delving deeper into the numbers, we appear to be confirming the validity of the sound bite.
However, there are more obstacles to overcome. 56 games appears impressive, but we have looked at on average just the final ten minutes of playing time for each game. In reality our sample size is only 567 minutes of actual playing time or the near equivalent of only six completed games. Manchester City in a run of six actual matches has produced an equivalent of 24 goals once over the last two seasons. As have United. If City (and United) can score at such impressive rates over a six match run selected from a season and half of games, it shouldn't be a great surprise that they can do likewise in a non random selection of 56 end games.
It's understandable that stats like this appear once such an event as a late goal has occurred, but as with super subs, this virtually guarantees a biased sample. The first of City's games in the 56 match run was a 4-0 win over Swansea on the opening day of the 2011/12 season, which saw Aguero scoring in injury time. The last game in the sequence was Reading on Saturday, when Barry did likewise. Probably inadvertently, we again have selective cut off points which start and finish with the attribute we are trying to measure in our sample.
If we extend the sample to included 2010/11 when City were still good enough to win the Cup, finish third with the same manger and many of the same players, we find that the gap between City and their nearest rivals over the period in the late goal stakes has shrunk from 12 goals to just 3. If we insist on comparing United and City over just the last two seasons we can also close the gap again to three by choosing the 81st minute instead of the by no means special 85th minute. The more you try to be fair and unbiased, the more biased cutoff points appear in the data.
City score lots of late goals because they are one of the two best teams currently in the Premiership and we can manipulate the apparent size of this advantage by taking results from different, but similar samples. If you dissect games into bite sized chunks of time, patterns will emerge that are neither representative of a team's real ability, nor repeatable in future contests. Quotes based on such inadvertently manipulated data are enticing, but have the power to mislead. As part of a wider picture such dicing of data may be useful, but in isolation they are prone to large corrections.
Poisson simulations using City's actual goal expectations from the 85th minute onwards in their last 56 games saw 24 or more late goals arriving in around 7% of the trials. City's 24 actual goals is an impressive achievement, but as larger samples and different timescales appear to indicate, a lower longterm figure should be expected, with little to chose between the Manchester clubs in this particular talent.....whatever the misleading sound bites might say.
Monday, 24 December 2012
Thursday, 20 December 2012
Red Cards and Goals in the EPL.
The goal scoring expectation of a side is reduced if they are shown a red card and they also become likely to concede goals in the remainder of the match at a higher rate than previously. But are more talented sides more able to overcome a numerical disadvantage than less talented ones and how does this impact on the amount of match goals we should expect to see in a contest in which a red card is shown.
In my guest post I look at every red card match in the EPL since 2005, comparing the goal expectancy values immediately prior to the dismissal with the reality of how 10 actually fared against 11.
To read the rest of the post follow this link
In my guest post I look at every red card match in the EPL since 2005, comparing the goal expectancy values immediately prior to the dismissal with the reality of how 10 actually fared against 11.
To read the rest of the post follow this link
Tuesday, 11 December 2012
Home Sweet Home.
Over the last couple of decades almost a third of the current Football League and Premiership clubs have upped sticks and left their previous homes for pastures new. Evocative names such as Saltergate, Layer Road, Leeds Road, The Goldstone Ground and The Victoria Ground have passed into history, to be replaced by more impersonal monikers such as The Ricoh Arena, The King Power (formerly the Walkers) Stadium, The Reebok, The Britannia and the imaginatively named Cardiff City Stadium.
Many of the bulldozed grounds had housed the local football team for generations and often the proposed move was met with a lukewarm response from many lifelong fans. Much improved facilities and the increasingly impractical locations of many original grounds meant that some of the early fan resistance has evaporated, but it is equally true that the new grounds needed time, coupled with some memorable results before they were fully accepted as home.
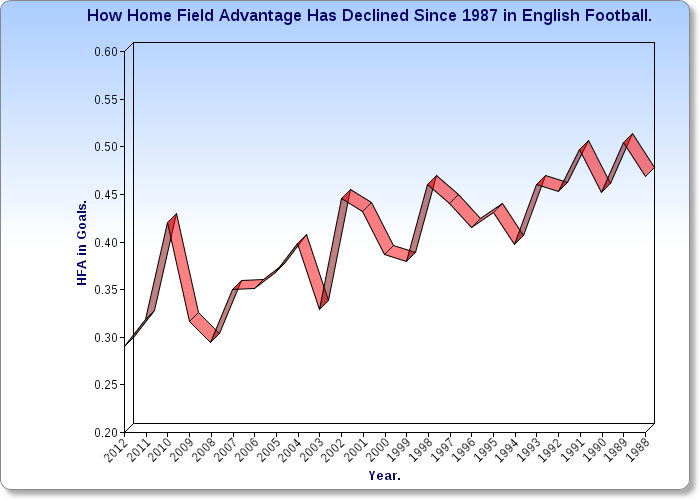
Home advantage is an almost constant feature of professional sports and is especially prevalent in team based sports. In football the home side's improved level of performance compared to their road game can be easily quantified. Although still a major component in driving the result of a sporting contest, home field advantage appears to be steadily declining in English football. Below I've plotted the average difference per game in goals scored by the hosts and those scored by the visitors combined for each of the four English leagues. Towards the end of the 80's a host side scored on average half a goal more than did their opponents, winning around 46% of such matches in the process. By last season, with an occasional blip such as 2009/10 HFA has shown a steady decline including a couple of season when it has dipped below three tenths of a goal.
Many theories exist to explain this constant feature of the footballing landscape. Crowd pressure may unduly influence the referee to favour the team with the most fans in the ground, almost always the home side. Studies have been carried out showing that incidents shown to referees with and without crowd noise results in different decision being made, but all of the refs in the study where amateurs from the Staffordshire FA. Hardly representative of a Premiership or Football league official. The constant decline over the last two decades would also appear to indicate that some factors are still evolving, with tactical formations being a likely and under investigated cause of the away side's increasing ability to compete.

The most widely accepted traditional reason for home field usually involves familiarity with your surroundings and a desire to protect territory increasing testosterone levels enabling the home side to enjoy a marginal advantage in the many individual contests which occur during a game, leading to an accumulated advantage at home compared to away fixtures. We can use the recent glut of relocations to try to test the familiarity claims.
A side beginning life in a new ground will be no more familiar with the surroundings than many of their opponents. Often the first opportunity a team will have to play on their new ground will be the opening league fixture and in the case of Stoke in 1997, The Potters had already played four away fixtures before their new ground was ready to host a match.
If home field advantage is partly driven by familiar surroundings, a team may sacrifice part of that advantage when they move homes and a decreased home premium may be present in the results. One season's worth of results for a single team may simply through a noisy sample throw up occasional home and away splits that aren't representative of larger samples. Home or away specialists can be seen every year in every division, but few if any retain the trait over larger numbers of trials. So instead of looking at the 27 individual cases where a side has played at a new ground I have aggregated all the cases.
We also need to account for the different home field environments in which each of the 27 individual seasons were played. Walsall left Fellows Park for The Bescot Stadium in 1990, when home English football sides were enjoying a home advantage of almost half a goal. In 2005/06 when Swansea moved to The Liberty it had fallen to around 0.35 of a goal.
How Levels of Home Field Advantage Change With A Change Of Ground.
Above I've charted the average HFA for all 27 sides in a couple of seasons prior to and post their move. I've compared this figure to the average weighted home field advantage for English football as a whole in the relevant years. In short a figure of 100% in the final column shows that the group of 27 were delivering the league average for home field advantage. Above 100 indicates they were enjoyed an enhanced HFA compared to the league as a whole and figures below 100 indicate a reduced comparable HFA.
The 27 teams were split fairly evenly across all four divisions, some were successful, while others celebrated their relocation by getting relegated just before their move. There was no reason to suppose that the group were consistently more proficient than usual at home (if such a species exists) and in the two years prior to their last season at their new home, the group produced dead eyed average HFA in each season.
In their final year they performed markedly better at home and while 27 completed seasons is a large sample size, I am reluctant to dive in and state that the players, fans and opponents are intent on giving the old ground a send off to remember. Of more interest is the dip in HFA that occurs in the first year at a new venue and only gradually recovers towards league expectations over successive seasons. Overall the 27 teams struggled to give the levels of home performance that their efforts on the road suggested they should have been capable of.
Some teams managed the transition effortlessly. Chesterfield had a great season at home, but Colchester struggled and overall more teams mirrored Colchester's experience, possibly indicating that home advantage had become more of a neutral experience that only improved with the passage of time.
A new ground gives the opportunity to examine results where one of the most cited causes of home advantage may be reduced. While competing and opposite factors may also be present after such ground hops, such as increased, if not always utilised extra capacity, there seems reasonable grounds to support the theory that familiarity breeds more points.
Many of the bulldozed grounds had housed the local football team for generations and often the proposed move was met with a lukewarm response from many lifelong fans. Much improved facilities and the increasingly impractical locations of many original grounds meant that some of the early fan resistance has evaporated, but it is equally true that the new grounds needed time, coupled with some memorable results before they were fully accepted as home.
Home advantage is an almost constant feature of professional sports and is especially prevalent in team based sports. In football the home side's improved level of performance compared to their road game can be easily quantified. Although still a major component in driving the result of a sporting contest, home field advantage appears to be steadily declining in English football. Below I've plotted the average difference per game in goals scored by the hosts and those scored by the visitors combined for each of the four English leagues. Towards the end of the 80's a host side scored on average half a goal more than did their opponents, winning around 46% of such matches in the process. By last season, with an occasional blip such as 2009/10 HFA has shown a steady decline including a couple of season when it has dipped below three tenths of a goal.
Many theories exist to explain this constant feature of the footballing landscape. Crowd pressure may unduly influence the referee to favour the team with the most fans in the ground, almost always the home side. Studies have been carried out showing that incidents shown to referees with and without crowd noise results in different decision being made, but all of the refs in the study where amateurs from the Staffordshire FA. Hardly representative of a Premiership or Football league official. The constant decline over the last two decades would also appear to indicate that some factors are still evolving, with tactical formations being a likely and under investigated cause of the away side's increasing ability to compete.
The most widely accepted traditional reason for home field usually involves familiarity with your surroundings and a desire to protect territory increasing testosterone levels enabling the home side to enjoy a marginal advantage in the many individual contests which occur during a game, leading to an accumulated advantage at home compared to away fixtures. We can use the recent glut of relocations to try to test the familiarity claims.
A side beginning life in a new ground will be no more familiar with the surroundings than many of their opponents. Often the first opportunity a team will have to play on their new ground will be the opening league fixture and in the case of Stoke in 1997, The Potters had already played four away fixtures before their new ground was ready to host a match.
 |
| Summer 1997 & The Brit is well on the way to being just a few weeks late. |
If home field advantage is partly driven by familiar surroundings, a team may sacrifice part of that advantage when they move homes and a decreased home premium may be present in the results. One season's worth of results for a single team may simply through a noisy sample throw up occasional home and away splits that aren't representative of larger samples. Home or away specialists can be seen every year in every division, but few if any retain the trait over larger numbers of trials. So instead of looking at the 27 individual cases where a side has played at a new ground I have aggregated all the cases.
We also need to account for the different home field environments in which each of the 27 individual seasons were played. Walsall left Fellows Park for The Bescot Stadium in 1990, when home English football sides were enjoying a home advantage of almost half a goal. In 2005/06 when Swansea moved to The Liberty it had fallen to around 0.35 of a goal.
How Levels of Home Field Advantage Change With A Change Of Ground.
| Season. | Average HFA (in goals) for Relocating Teams. | Weighted Average HFA for All Seasons. | Team HFA as a % of League Average. |
| 3 Years Before Move. | 0.40 | 0.40 | 100 |
| 2 Years Before Move. | 0.40 | 0.40 | 100 |
| Last Year In Old Ground. | 0.50 | 0.41 | 122 |
| First Year In New Ground. | 0.34 | 0.39 | 88 |
| Second Year In New Ground. | 0.34 | 0.37 | 92 |
| Third Year In New Ground. | 0.37 | 0.39 | 95 |
Above I've charted the average HFA for all 27 sides in a couple of seasons prior to and post their move. I've compared this figure to the average weighted home field advantage for English football as a whole in the relevant years. In short a figure of 100% in the final column shows that the group of 27 were delivering the league average for home field advantage. Above 100 indicates they were enjoyed an enhanced HFA compared to the league as a whole and figures below 100 indicate a reduced comparable HFA.
The 27 teams were split fairly evenly across all four divisions, some were successful, while others celebrated their relocation by getting relegated just before their move. There was no reason to suppose that the group were consistently more proficient than usual at home (if such a species exists) and in the two years prior to their last season at their new home, the group produced dead eyed average HFA in each season.
In their final year they performed markedly better at home and while 27 completed seasons is a large sample size, I am reluctant to dive in and state that the players, fans and opponents are intent on giving the old ground a send off to remember. Of more interest is the dip in HFA that occurs in the first year at a new venue and only gradually recovers towards league expectations over successive seasons. Overall the 27 teams struggled to give the levels of home performance that their efforts on the road suggested they should have been capable of.
Some teams managed the transition effortlessly. Chesterfield had a great season at home, but Colchester struggled and overall more teams mirrored Colchester's experience, possibly indicating that home advantage had become more of a neutral experience that only improved with the passage of time.
A new ground gives the opportunity to examine results where one of the most cited causes of home advantage may be reduced. While competing and opposite factors may also be present after such ground hops, such as increased, if not always utilised extra capacity, there seems reasonable grounds to support the theory that familiarity breeds more points.
Saturday, 8 December 2012
The Trouble With Pythagoras.
In this recent post I looked at how the Pythagorean approach to converting runs scored and conceded in baseball or points totals in American Football can be utilized to give a more representative win and loss record over a season long timescale. A large number of narrow victories can inflate at side's final league record, but much of this success may be down to randomly fluctuating fortunes and there is no guarantee that these will be repeated in the future. A team's scoring record can partly capture such bouts of good or bad fortune and the luck bearing contribution to league points can be identified using the Pythagorean method, once draws and scoring environments have been accounted for.
Simply eyeballing a side's goal difference can also achieve the same aim and Newcastle were the poster side for over achievement last season when they claimed 5th spot with goal difference of +5. The competitive balance within the current Premiership is relatively fixed from year to year and Newcastle's goal difference would usually have only been good enough for seventh spot, if not lower. They were out of place, probably by a couple of spots. The case of Newcastle has been extensively covered and eight wins by a one goal margin, coupled with three reasonably heavy defeats were the main factors behind their depressed goal difference and elevated finishing position.
Pythagorean expectation captured Newcastle's atypical season, but so did anyone who took a passing interest in the table or results. So how can this cross over from Sabermetrics begin to be used beyond spotting transparent outliers ?
Much of the effort in transferring Pythag to football has revolved around reducing the error associated with predicted final points totals and actual totals in the same campaign. A Premiership season of 38 games is usually sufficient for skill to begin to overwhelm randomness and the best teams invariably rise to the top. Therefore trying to match your improved model of reality with actual reality is a reasonable aim. A team's true worth is often hidden, but the distortion is reduced in sports such as football where skill is a considerable factor. However, care should be taken not to overfit a Pythag model of reality to the random elements that occur in matches over the season.
Taking data such as goals scored and conceded over a season to create a model and then fitting that model to those very same matches runs the very real risk of forcing your creation to conform to random noise as well as signal. Once let loose on new data any predictive qualities may well be compromised as solid patterns reveal themselves as little more than randomness. Extensive, out of sample testing is much the way to go in attempting to validate a model based conclusion.
A second stumbling block is the aggregation of data. A glut of narrow wins or defeats may show up in a 38 game season's worth of scoring events. But a hefty, often red card assisted defeat can hang heavy over a side's goal difference as a result of the low scoring in football.
Manchester United 8 Arsenal 2 and United 1 City 6, with a couple of red cards had the capacity to play havoc with a carefully tended Pythag bought up in the USA, where individuals are ejected, but teams are often allowed to remain at full strength. As luck would have it both of United's results eventually cancelled each other out, although the Arsenal result hung heavy on each side's goal difference early in the season. Data aggregation has it's benefits, but one, unusually high scoring game can also be smeared over a whole group of games resulting in a distorted representation of what actually occurred.
There was a time in the top flight when 1-0 wins on the back of an impressive defensive display was widely admired and some present day sides still possess the quality of defenders and tactical nous to engineer such results as part of their normal matchday experience. Five 1-0 victories coupled to a 6-1 defeat accrues 15 actual points, a goal for and against tally of 6-6 and a reputation for being fortunate, over achievers. Six 1-1 draws gets a team just 6 points, the same goal tally and an "unlucky" tag. But Pythagoras treats both teams the same and gives them each a "true" expected points total of around 8 for those six games.
Real life examples will rarely be as extreme, but if we know the actual, individual results, we should try to use that information. One way around this Pythagorean "draining the detail from the data" problem is to treat each match individually and then aggregated the expected points. Thus, a team which managed to run up the score in a single match wouldn't be credited with the ability to be equally threatening in front of goal under more competitive conditions.
A 7-0 win would tend towards three expected Pythag points for that match and a narrow 1-0 win would lead to a Pythagorean contribution that was nearer to two league points, acknowledging the range of outcomes that may occur when defending a narrow lead. The attractive concept of downgrading teams succeeding on the back of winning a lot of close matches would be retained, without the season wide points inflation for a side enjoying "one of those days" and winning a game or two by a wide margin.
If the Pythagorean method is to have any use over and above the many similar techniques that already exist for football, it has to be prepared to look at matches on a game by game basis to maximize it's unique selling point, namely the ability to begin to identify some of the randomness that is incorporated into a team's actual record. In my previous post I looked at the predictive power of the Pythagorean league points totals from one season to the next using aggregated scoring data. Repeating the exercise, but on an individual match by match basis and then summing the expected league points, leads to an improved correlation between "true" Pythagorean points totals in season N-1 and a team's actual points haul in season N.
Identifying attributes that contribute to a side's success is an important aim for analysis and one way to test if a model has achieved this aim is to see if it has predictive qualities. Pythag appears to be reasonably predictive of future performance and applying the method to individual matches also opens the way for a predictive Pythag for yet to be played, single matches rather than merely confining it's use to seasonal points totals.
However, it is competing in a crowded, well tested market, where tools already exist to duplicate it's output. There is scope and a requirement for much further development.
Check out Martin Eastwood's pena.lt/y Blog for an Excellent Pythag Primer.
Friday, 7 December 2012
What the Bookmaker's Prices Told Us About Shakhtar v Juventus.
Much of the pregame chatter surrounding the Shakhtar verses Juventus UEFA Champions League tie concerned the mutually beneficial outcome should the teams draw their final group game. Shakhtar were already assured of qualification to the knockout stages, but a point would secure them top spot in the group and eliminate the possibility that they would face likely fellow table toppers, Barcelona in the first round of ties. Juventus were on much more precarious ground, a draw would also ensure that they progressed as runners up, but defeat and the highly likely win for Chelsea against Nordsjaelland would see them eliminated.
Draws are the one result that can be predicted with the least certainty. They are most likely to occur when two teams have a similar chance of winning the match outright, most usually when an inferior team, boosted by home field advantage entertains a marginally superior side. A prolonged propensity for both sides to participate in relatively low scoring matches also helps to increase the chances of a stalemate. However, even if these requirements are fulfilled the probability of deadlock rarely rises much above 30%.
Mid table teams are more likely to be involved in draws than title contenders or relegation candidates, but the discrepancy is much less extreme than it is for wins or losses. The partly random way in which draws materialise is further illustrated by the lack of season on season correlation. A team which draws extensively one season isn't guaranteed to carry this tendency onto future campaigns.
Rarely will a draw be offered at prices shorter than 2/1 or 3.0 in decimal terms, yet by mid afternoon of the Shakhtar/Juventus game the price had contracted to around 2.18, indicating a likely chance of around 45%.
Many have begun to realize the value of using bookmakers prices as a free and valuable resource. An accurate assessment of the true probability of a sporting outcome occurring is essential to any successful bookmaker, although weight of money can sometimes distort prices. We can therefore use these prices to try to piece together how this match was perceived by a combination of expert and mass market opinion.
Juventus had previously entertained Shakhtar in matchday two on October the 2nd. So early in the competition there would likely be no extraneous factors which would distort the price of the match. Prices would have reflected the relative abilities of each side along with home field advantage for the Italians. Juventus were priced up at a best price 1.61 or around 62% with the draw at 3.9 or 26% . If we use these prices from October to project a price for the rematch in December, assuming relative stability of each team's ability we would make Juventus marginal favourites once the venues where flipped and more importantly the draw would be pitched as a 27% chance.
So we had a price for the draw set at mid afternoon of the final group match at 45% when everything pointed to an expected price for a "normal" contest being in the region of 27%. The assumption across the net was that a draw was assured as it ensured a best case outcome for Shakhtar and a second best case outcome for Juve. And as that assumption gained credence, weight of money dragged the price to even higher levels of certainty. By kickoff the odds of a draw had further contracted to 10/11 or 52%.
Given the sometimes tainted history of some European club sides, were the odds telling us that the draw had been agreed or where they telling us something about the way in which the game was expected to be played out ?
The concluding matches of many competitions are atypical of what has gone before. May in the Premiership sees more goals than mid season, less cards and a collection of meaningless and meaningful matches. Stoke have faced a seemingly endless stream of late season matches where team priorities are mixed. None more so than a final game visit of Reading, already locked into a Premiership playoff position early in Pulis' initial tenure, where Stoke required a win to ensure another season of Championship football. An initially enthusiastic Reading tamely folded to a characteristic single goal defeat. In short, the Royals did what was expected of them by teams embroiled in a relegation scrap with Stoke, but ultimately they took a more relaxed stance and prepared for future matches.
A more contemporary example was seen on Wednesday night when the team selection and subsequent performance of an already qualified Manchester United saw them taste defeat at the hands of a committed Cluj, who won and narrowly failed to progress. Differing priorities, rather than collusion lead to defeats for Reading and Manchester United.
Draw prices of 45 or even 50% are virtually unheard of pregame, but they do exist in running and the goal expectancy of the Shakhtar/Juve match would decay by an amount corresponding to a 45% draw probability after around 50 minutes of initial stalemate.
The net predictably abounded with conspiracy theories regarding the match, complicated by the Russian connection between Shakhtar and Chelsea, the fall guys in any agreed draw. But more experienced opinions appeared to be quantifying the chances that the game would exist as a true contest for around 50 minutes, at which point fair play would be satisfied and the game could then be allowed to peter out to the most likely outcome under that scenario, namely a draw.
The ebb and flow of the game indicates that Juventus out shot Shakhtar by two to one until their fortuitous winner around the hour and then the hosts out shot their visitors by the same amount. So the flow of the game appeared to see Shakhtar content to protect their top slot, while their visitors attempted to claim it from them and then the host attempting to reclaim their prize once the own goal gifted it to Juve. Without the goal, the expected truce may have been forthcoming.
Fixed results are thankfully rare in football and when agreed draws do occur, the odds on offer are a lot shorter than a shade of even money, with odds of 1.2 not uncommon. What we saw initially on Wednesday was almost certainly an experienced odds maker deducing that an evenly matched pair of teams, on the night would play out a game that could become uncompetitive should it remain stalemated relatively early in the second half and even if a goal was scored, the game would contain many persuasive routes to an ultimate draw. And that opinion was reflected in the initial, mid afternoon prices for the draw, an unusual pricing for an uncommon set of circumstances.
* For anyone confused about converting the variety of different odds commonly seen to probabilities, an excellent primer can be found here.
Thursday, 6 December 2012
The FA Cup in an Era of Premiership Dominance.
The FA Cup has been dominated by the top flight teams since the start of the Eighties, with the very best Premiership outfits inevitably to the fore in the most recent past. The only real crumb of comfort for teams outside of the top flight is the random nature of the draw that can see Premiership teams eliminating each other. Four or more all Premiership 3rd round ties has led to late stage involvement for Championship sides over the last decade. Check out my guest post here for much more detail.
Sunday, 2 December 2012
Expected Points Graph For Reading 3 Manchester United 4.
Reading 3 Manchester United 4.
Stoke City have become the benchmark for a team attempting to make the not inconsiderable leap from Championship high flier to Premiership survivour. A combination of defensive resilience and maximizing scoring opportunities, especially from set plays are two of the founding principles of Pulis ball and while there was evidence on Saturday night that Reading have embraced the second, they were sadly lacking in the former.

Scorers.
1-0, Robson-Kanu, 8'
1-1, Anderson, 13'
1-2, Rooney (pen), 16'
2-2, Fondre, 19'
3-2, Morrison, 23'
3-3, Rooney, 30'
3-4, v Persie, 34'
Attempting to outscore Premiership opponents, especially the very best is rarely a profitable approach for EPL newcomers, the more goals there are in a game then the more likely it is that the better team will score the lions share. Reading's matches were averaging three goals per game prior to the visit of Manchester United on Saturday evening, above the league average and well in excess of Stoke's recent survival years back in the top flight. Stoke matches have averaged a low of 2.2 and a high of 2.4 goals per game since their return to the Premiership and are currently averaging below two goals so far in 2012/13. If Premiership strugglers are going to upset the very best it's more likely to occur in a low scoring game. Of the 50 defeats suffered by United to teams outside the rest of the big four, half have been single goal defeats.
Entertaining as the open spectacle was, an ultimate United win was hardly a surprise. Only briefly, when they led 3-2 on the half hour did The Royals claim favouritism in the match and a United win would have been even more assured if v Persie's "fifth" goal had stood.
The first half did illustrate the potency of corner kicks , as described here, especially when the ball is delivered to the correct areas and attackers work hard at freeing themselves from defensive attention. Reading's second and third goals were text book examples of the art of scoring from a set piece.
The seven goal, first half scoring spree was undoubtedly unusual, even for two sides whose matches are likely to contain more than the average number goals this season. One such half of football per hundred Premiership seasons would still be an optimistic expected rate for a 3-4 half time scoreline. Inevitably, pundits were predicting more of the same in the second period, but pregame estimated scoring rates are more often a better predictor of what may occur than is a single 45 minutes of action. Viewers were primed for the Premiership total goals record of eleven for one match to be threatened, if not breached, but no more scores were forthcoming.
A goalless second period was around a 20% chance and it was an 80% chance that there would be no more than two goals scored in the last 45 minutes. The chances of Reading and Manchester United combining to provide the five or more additional goals required to breach the single game record could be measured at below 2%.
Friday, 30 November 2012
Defending Your Corner. The Anatomy of a Stoke Goal.
Unlocking the secrets of a football match can be made slightly easier by concentrating on the important actions, such as shots and saves for individual players and set pieces, including free kicks and corners for teams. Set plays by their premeditated nature offer a relatively consistent level of defensive and attacking opportunity and by looking at the effectiveness of teams against a variety of different opponents we may be able to start to characterize what constitutes good set play defence and attack.
Manchester City demonstrated how important turning corners into goals is to a team's season. Generally, in the 15 Premiership goals which they scored in the immediate aftermath of a corner kick over the season as a whole and particularly, with the vitally important late season winner against title rivals, United and the 92nd minutes equaliser at the climax of the title race at home to QPR.
The champions also greatly improved their scoring rate from corner kicks compared to the previous year, perhaps indicating that there is profit to be had from identifying and implementing a successful set piece strategy.
One team which has long understood the importance of dealing with corner kicks at both ends of the field is Stoke City. Their opening goal against West Ham was clearly the product of work put in on the training field, with Gary Neville describing Walters' strike as "one of the goals of the season". Others preferred to highlight the perceived illegality which preceded the strike. Blocking opponents to provide clear space for a team mate isn't restricted to football, sending dummy runners in front of the intended ball receiver is now well establish in rugby, but physically preventing attackers from getting a clear run in football has even survived the introduction of extra officials in the European competitions. In short referees have set a line in the sand for acceptable behaviour at corner kicks which may not be fully reflected in other areas of the pitch and all teams exploit that leeway to the maximum of their ability.
Measuring corner kick success does require a certain degree of subjectivity. For example, six of Manchester City's set play goals came directly from first headed contact with the corner and three other from assists. Other scores came from extended play following a short corner or a ball deliberately played to a central area just outside the edge of the penalty box. Therefore it is sensible to divide corners into situations, such as short corners where possession is guaranteed and occasions where the ball is played directly into the box where the possession pay off is less, but if first contact is made with the cross, it is in a more threatening area.
The availability of x, y coordinates for match events has allowed us to chart match incidents, attempt to define success and quantify success rate for different areas of the pitch. In 2011/12 Stoke won over 150 corner kicks in the EPL. As you'd expect for a side blessed with such an aerial threat very few kicks were played short or to the edge of the box. The average position for the targeted area was just north of the six yard line and around a foot west of the penalty spot in the direction of the near post.
In short, Stoke were aiming for the area in the box where a clear header is increasingly likely to produce a goal. As this post shows, the further you get from the goal, the less likely you are to score with a header compared to a shot, but inside the six yard box the situation is reversed an headers are an extremely potent option.
In this initial analysis, I've recorded all of Stoke's corner kicks and used a Stoke player making first contact with the cross as a broad definition of a successful kick. As a comparison I've included the "success" record for all the other EPL teams when launching corners into the Stoke box. We are looking at a combination of Stoke's corner taking ability matched to their opponents ability to defend the ball and vice versa.
I'm going to try to avoid overuse of figures in this post, but I will use them to verify my intuition that Stoke have worked very hard at defending and attacking corners over the last two completed seasons. The line of the six yard box appears to be the crucial area where header start to lose potency. Corners are also likely to see the six yard box more heavily defended than is the case in open play, so while conversion rates are likely very high deep into the six yard box, the likelihood that an attacking player will get the first touch quickly falls away to around 3% or less as he nears the goal line in the case of corners.
The starkest comparison between Stoke defending and attacking corners is in their ability to get the first touch to corners hit centrally to the six yard line. They have around a 1 in 5 chance of beating the defence to the ball, whilst restricting their opponents to barely half that success rate.
Although the goal mouth action following a corner appears very haphazard, more of the initial movement and delivery is well rehearsed. Stoke's attacking and defensive ratios may be unsustainably high but as a team, they are undeniably well versed in creating and denying space at corners.
The above photo shows Stoke's opening goal at home to Swansea, this season. Glenn Whelan has already executed the first part of a successful corner by accurately hitting an inswinging corner at pace, centrally to the edge of the six yard box. The pace of the cross ensures that the Swansea keeper is reluctant to leave his line, but just to be sure, Steven N'Zonzi (1) takes just enough of his ground to make staying put appear a better option. N'Zonzi's height also enables him to hinder Vorm's ability to clearly see the action as it unfolds in front of him.
Huth (2) is just one of Stoke's incoming runners, Walters is off camera to the left and Huth's imposing size accounts for two Swans defenders. Shawcross has already ran corner side of the near post to draw another defender out of the six yard box. Despite his heading prowess, he has been used here as a decoy runner, or as an insurance should the corner be under hit.
The decisive action has occurred far post. Adam (3) is partly there to act as a blocker for target Crouch (4). Crouch has run his marker in towards the far post before peeling back into the middle of the box where the ball is going to be delivered. His marker has anticipated a far post run, but now finds himself blocked off by Adam, who merely has to stand his ground to give Crouch an unmarked free header, which he duly dispatches. N'Zonzi is ready to become active should the ball be blocked on the line.
It's great when a plan comes together as it did here and against West Ham as illustrated by Neville and each of the seven Stoke players had an important part to play in freeing Crouch for a clear header.
Defensively the Stoke players are intent on staying close to their opponents. Shawcross and Wilson in the first shot and Shawcross and Cameron in the second are engaging their marked opponents to such an extent that challenging for the ball becomes almost secondary. Walters and Wilson in the second photo are also physically imposing themselves on the two most likely recipients of the Swansea cross. In short, physicality, denying strikers the freedom to make runs and a 6'5" keeper goes some way to explaining Stoke's ability to prevent their opponents from enjoying the same amount of successful first contact with corner kicks which they themselves enjoy.
These are idealized examples of Stoke City dealing with corners at both ends of the pitch, but the stats clearly indicate that they are likely to be above average in both abilities. Their opponents have acknowledged the futility of attacking the heart of Stoke's six yard box directly, by taking around 20% of corners short. Stoke, by contrast took less than 4% of their corners short last term.
Pulis has long relied on a mean defence to maximize his team's dearth of goal scoring and goalsoring from corner kicks regularly account for a significant proportion of their goals. Scoring rates of a goal a game aren't uncommon for Pulis led sides and this season is no exception and 15% of the strikes have come directly from corners.
The numbers can help to identify trends in team quality, but often game footage can then add the meat to the story. Stoke are adept at creating and denying space and the hard work, often on the edge of legality rarely appears explicitly in the currently recorded data.
Manchester City demonstrated how important turning corners into goals is to a team's season. Generally, in the 15 Premiership goals which they scored in the immediate aftermath of a corner kick over the season as a whole and particularly, with the vitally important late season winner against title rivals, United and the 92nd minutes equaliser at the climax of the title race at home to QPR.
The champions also greatly improved their scoring rate from corner kicks compared to the previous year, perhaps indicating that there is profit to be had from identifying and implementing a successful set piece strategy.
One team which has long understood the importance of dealing with corner kicks at both ends of the field is Stoke City. Their opening goal against West Ham was clearly the product of work put in on the training field, with Gary Neville describing Walters' strike as "one of the goals of the season". Others preferred to highlight the perceived illegality which preceded the strike. Blocking opponents to provide clear space for a team mate isn't restricted to football, sending dummy runners in front of the intended ball receiver is now well establish in rugby, but physically preventing attackers from getting a clear run in football has even survived the introduction of extra officials in the European competitions. In short referees have set a line in the sand for acceptable behaviour at corner kicks which may not be fully reflected in other areas of the pitch and all teams exploit that leeway to the maximum of their ability.
Measuring corner kick success does require a certain degree of subjectivity. For example, six of Manchester City's set play goals came directly from first headed contact with the corner and three other from assists. Other scores came from extended play following a short corner or a ball deliberately played to a central area just outside the edge of the penalty box. Therefore it is sensible to divide corners into situations, such as short corners where possession is guaranteed and occasions where the ball is played directly into the box where the possession pay off is less, but if first contact is made with the cross, it is in a more threatening area.
The availability of x, y coordinates for match events has allowed us to chart match incidents, attempt to define success and quantify success rate for different areas of the pitch. In 2011/12 Stoke won over 150 corner kicks in the EPL. As you'd expect for a side blessed with such an aerial threat very few kicks were played short or to the edge of the box. The average position for the targeted area was just north of the six yard line and around a foot west of the penalty spot in the direction of the near post.
In short, Stoke were aiming for the area in the box where a clear header is increasingly likely to produce a goal. As this post shows, the further you get from the goal, the less likely you are to score with a header compared to a shot, but inside the six yard box the situation is reversed an headers are an extremely potent option.
In this initial analysis, I've recorded all of Stoke's corner kicks and used a Stoke player making first contact with the cross as a broad definition of a successful kick. As a comparison I've included the "success" record for all the other EPL teams when launching corners into the Stoke box. We are looking at a combination of Stoke's corner taking ability matched to their opponents ability to defend the ball and vice versa.
I'm going to try to avoid overuse of figures in this post, but I will use them to verify my intuition that Stoke have worked very hard at defending and attacking corners over the last two completed seasons. The line of the six yard box appears to be the crucial area where header start to lose potency. Corners are also likely to see the six yard box more heavily defended than is the case in open play, so while conversion rates are likely very high deep into the six yard box, the likelihood that an attacking player will get the first touch quickly falls away to around 3% or less as he nears the goal line in the case of corners.
 |
| Stoke's Opening Goal from a Corner against Swansea. |
Although the goal mouth action following a corner appears very haphazard, more of the initial movement and delivery is well rehearsed. Stoke's attacking and defensive ratios may be unsustainably high but as a team, they are undeniably well versed in creating and denying space at corners.
The above photo shows Stoke's opening goal at home to Swansea, this season. Glenn Whelan has already executed the first part of a successful corner by accurately hitting an inswinging corner at pace, centrally to the edge of the six yard box. The pace of the cross ensures that the Swansea keeper is reluctant to leave his line, but just to be sure, Steven N'Zonzi (1) takes just enough of his ground to make staying put appear a better option. N'Zonzi's height also enables him to hinder Vorm's ability to clearly see the action as it unfolds in front of him.
Huth (2) is just one of Stoke's incoming runners, Walters is off camera to the left and Huth's imposing size accounts for two Swans defenders. Shawcross has already ran corner side of the near post to draw another defender out of the six yard box. Despite his heading prowess, he has been used here as a decoy runner, or as an insurance should the corner be under hit.
The decisive action has occurred far post. Adam (3) is partly there to act as a blocker for target Crouch (4). Crouch has run his marker in towards the far post before peeling back into the middle of the box where the ball is going to be delivered. His marker has anticipated a far post run, but now finds himself blocked off by Adam, who merely has to stand his ground to give Crouch an unmarked free header, which he duly dispatches. N'Zonzi is ready to become active should the ball be blocked on the line.
It's great when a plan comes together as it did here and against West Ham as illustrated by Neville and each of the seven Stoke players had an important part to play in freeing Crouch for a clear header.
 |
| Stoke Defend a Swansea Corner.... |
 |
| ....and another. |
Defensively the Stoke players are intent on staying close to their opponents. Shawcross and Wilson in the first shot and Shawcross and Cameron in the second are engaging their marked opponents to such an extent that challenging for the ball becomes almost secondary. Walters and Wilson in the second photo are also physically imposing themselves on the two most likely recipients of the Swansea cross. In short, physicality, denying strikers the freedom to make runs and a 6'5" keeper goes some way to explaining Stoke's ability to prevent their opponents from enjoying the same amount of successful first contact with corner kicks which they themselves enjoy.
These are idealized examples of Stoke City dealing with corners at both ends of the pitch, but the stats clearly indicate that they are likely to be above average in both abilities. Their opponents have acknowledged the futility of attacking the heart of Stoke's six yard box directly, by taking around 20% of corners short. Stoke, by contrast took less than 4% of their corners short last term.
Pulis has long relied on a mean defence to maximize his team's dearth of goal scoring and goalsoring from corner kicks regularly account for a significant proportion of their goals. Scoring rates of a goal a game aren't uncommon for Pulis led sides and this season is no exception and 15% of the strikes have come directly from corners.
The numbers can help to identify trends in team quality, but often game footage can then add the meat to the story. Stoke are adept at creating and denying space and the hard work, often on the edge of legality rarely appears explicitly in the currently recorded data.
Wednesday, 21 November 2012
Poisson, Predictions and a Tense Last Ten Minutes.
Often the bigger the incentive is to get things right, the better the final results and the potential for you to lose money in an enterprise inflates that incentive .One "hidden" resource in the field of football analytics is provided by the gambling industry, who regularly produce sporting predictions that are occasionally skewed by weight of money, but more often provide a readily decipherable estimate of an event's true likelihood of occurring. Therefore, this post is written with a betting slant, but it is centrally applicable to the field of football analytics.
Everyone takes for granted the opportunity to bet on a sporting event "in running". However, it is worth remembering that it is a relatively new concept and as such the betting tools developed to describe such events are similarly under developed. Rewind a decade and once the first whistle was blown or the stalls opened, then the betting shutters were slammed tightly shut. Nowadays the betting carries on unabated.
Football is an obvious vehicle for in running wagers and that has created a need to predict match probabilities under many different combinations of scoreline and time elapsed. Aggregating many season's worth of historical data does a reasonable job of describing the general case, but is clearly lacking when applied to specific team matchups.
The major problem with these type of models is biased sampling. Poorer teams playing superior teams are more likely to find themselves trailing, say 2-0 after 45 minutes. So the sample used to predict the likely game outcome from this position will contain an over representation of poor sides and they will go on to perform in accordance with the wider gap in quality over the remainder of the game. In using this biased, general case to predict how Manchester City may perform should they trail 2-0 at halftime to the likes of Stoke will greatly underestimate the possibility of a Blue comeback. The chances of Manchester City storming back for a win in such circumstances is over twice that seen generally.
So if aggregated models have a major flaw too far, what are we to use ? The data revolution has enabled predictions to be made using vast amounts of different inputs, but this approach has produced a counter movement, where simplicity of design and input is thought to produce results of equal merit. A simple goal based model, using the outputs of a Poisson calculation on a team's average goal expectancy to calculate the probability of each side scoring an exact number of goals in a match has been well described in numerous websites since the late 90's.
This approach too has flaws, such as under prediction of draws and failure to account for a lack of independence between the expected scoring rates of both sides. However, these flaws are both well understood and because Poisson has long been used in football prediction, these problems have been extensively addressed.
I'll assume everyone has a passing knowledge of the Poisson approach to modelling football matches, but for the casual reader, the distribution allows an estimation of the likelihood of a team scoring exactly 0,1,2,3 goals and so on given we expect that team to score and average of say 1.6 goals in such a game. To fully appreciate how we can use the Poisson approach to begin to build an in running calculator we first need to grasp the concept of goal expectation.
When we say that a side has a goal expectation of 1.6 goals, we are saying that if today's game were to be repeated over and over again, the average number of goals we would expect our team to score would be 1.6. Sometimes they wouldn't score at all, sometimes they would score 6. The most likely outcome would be a score of exactly one, followed by two. But over a long period of repeats, the average would trend towards our best estimate of 1.6.
The most important thing we need to appreciate is how this goal expectancy decays over the 90+ minutes of a match. The average 1.6 goals per game figure decays because of time elapsed. Goals already scored or conceded may tweak the average slightly in one direction or another as a result of competing, scoreline dependent, tactical rearrangements, but a glut of early goals doesn't significantly alter our pregame goal expectancy.....only the passage of time can do that.
The rate at which a team's goal expectancy declines isn't constant. More goals are scored on average in the second half than the first as teams become more urgent in their efforts to score and fatigue leads to more space. The rates are around 44% for the former and 56% for the latter and the decay can be adequately described by an exponential equation of the following form.
Remaining Goal Expectancy = Initial Goal Expectancy x (Proportion of Time Remaining) ^0.84
Imagine Stoke is expected to score an average of 1 goal in a particular match, West Ham away on Monday night, perhaps. By halftime when the proportion of time remaining is very close to 0.5, the remaining goal expectancy can be calculated by inserting these values into the previous formula to give
Remaining Goal Expectancy = 1 x (0.5)^0.84 = 0.562 of a goal.
0.562 of a goal, you may notice equates to 56% of the initial goal expectation of 1 goal, which nicely fits the observed data. We can repeat this calculation for any minute of the match and also for the opposition. Armed with this information we are just a few repetitive, but simple steps away from being able to describe the likely scoring combinations that will occur in the remainder of the contest.
We'll fast forward to the 80th minute to use this accumulated knowledge to begin to construct a flexible and realistic "in running" prediction model. The West Ham/Stoke game was a fairly common type of Premiership contest, where two reasonable well matched sides were separated on the night by little more than home field advantage. An average expectation at kickoff for Stoke would be that they'd score close to one goal and concede just over 1.4 of a goal to the Hammers. If we insert those numbers into our equation and allow for the likely 4 minutes of added time we could expect Stoke to average 0.22 of a goal to West Ham's 0.30 in the remainder of the match.
If we now fire up the Poisson calculator we can produce probabilities that Stoke and WHU will score exactly 0,1,2,3 goals and so on, in the last 10+ minutes of Monday's game. Those probabilities are listed below.
The Likelihood of Stoke or WHU Scoring an Exact Number of Goals after the 79th Minute.
We can now begin to accumulate the score combinations that will lead to a final match outcome, bearing in mind that O'Brien had equalised Walters' opening goal for the visitors and the match was currently stalemated. If, as actually happened, neither side scores, the match ends as a draw and the probability of a 0-0 is given by multiplying 0.737 by 0.806 or the individual probabilities of each side failing to score. That outcome has a probability of 0.594 or around 3 times in every 5. A 1-1 in the final "mini" match will also ultimately lead to a draw, as would a 2-2, 3-3 or 4-4 for the optimistic thrill seekers. If we finally total each of these individual, correct score probabilities, we have the likelihood of the currently tied game ending so at the final whistle.
A similar process generates cumulative probability totals for each correct score that leads to either a City win or a happy Hammers victory.
The Likelihood of Stoke or WHU Gaining any Result from 1-1 after the 79th Minute.
The above example is conveniently simplified by a current scoreline of 1-1, but teams can both trail or lead as WHU and Stoke respectively did in this match. However, the process merely becomes slightly more tedious rather than more complex. Stoke's set piece prowess finally reached ground level in the 13th minute when Walters found space in front of decoy runners to crisply dispatch a precisely delivered Whelan corner, an inventive deviation from the Delap assists of old. So if we want to examine the likely match result from say the 34th minute we have to also account for the 1-0 lead held by Stoke.
In this game situation, should Stoke go on to "win" the mini match from the 34' onwards, they will bolster their lead and comfortably win the game. In addition, if they merely "draw" the remainder of the match they will also win the entire game because of the 1-0 lead given to them by their mustachioed striker. An actual draw requires WHU to "win" the next 60 minutes by a single goal or by two or more to claim all three points.
The Likelihood of Stoke or WHU Gaining any Result from 0-1 after the 33rd Minute.
As the scoreline becomes more lopsided, the combinations that ultimately lead to wins, losses or draws also becomes more diverse. A team which holds a 2 goal cushion can afford to "lose" the remainder of the contest by a single goal and still claim victory. So the totting up procedure becomes more tiresome, although a spreadsheet helps greatly, but the Poisson process on a suitably decayed goal expectation remains constant.
As has already been stated, this quick run through does not account for well recognised deficiencies in using Poisson to describe football goal scoring, nor does it allow for the small, but real emphasis shifts that occur as the scoreline changes, but we can test the model's validity by comparing it's predictions to the efficient Betfair betting markets.
Below I've plotted the near 100% book prices that were available on Betfair in two minute intervals, along with the predictions from a pure Poisson during Monday night's Stoke West Ham match.
Price & Probability Movements During Stoke's 1-1 Draw At WHU.


Scorers.
0-1,Walters, 13'
1-1, O'Brien, 48'
The Betfair prices and the pure Poisson track each other's progress fairly accurately. The under prediction of the draw, inherent in the Poisson is well seen up until the WHU equaliser and my allegiance to one of the two side may also be represented throughout by my choice of initial goal expectations. Also the slightly increased optimism towards WHU during the half hour where they trailed isn't captured by the "blind" Poisson, but is by the Betfair traders and is also present in actual data.
Everyone takes for granted the opportunity to bet on a sporting event "in running". However, it is worth remembering that it is a relatively new concept and as such the betting tools developed to describe such events are similarly under developed. Rewind a decade and once the first whistle was blown or the stalls opened, then the betting shutters were slammed tightly shut. Nowadays the betting carries on unabated.
Football is an obvious vehicle for in running wagers and that has created a need to predict match probabilities under many different combinations of scoreline and time elapsed. Aggregating many season's worth of historical data does a reasonable job of describing the general case, but is clearly lacking when applied to specific team matchups.
The major problem with these type of models is biased sampling. Poorer teams playing superior teams are more likely to find themselves trailing, say 2-0 after 45 minutes. So the sample used to predict the likely game outcome from this position will contain an over representation of poor sides and they will go on to perform in accordance with the wider gap in quality over the remainder of the game. In using this biased, general case to predict how Manchester City may perform should they trail 2-0 at halftime to the likes of Stoke will greatly underestimate the possibility of a Blue comeback. The chances of Manchester City storming back for a win in such circumstances is over twice that seen generally.
So if aggregated models have a major flaw too far, what are we to use ? The data revolution has enabled predictions to be made using vast amounts of different inputs, but this approach has produced a counter movement, where simplicity of design and input is thought to produce results of equal merit. A simple goal based model, using the outputs of a Poisson calculation on a team's average goal expectancy to calculate the probability of each side scoring an exact number of goals in a match has been well described in numerous websites since the late 90's.
This approach too has flaws, such as under prediction of draws and failure to account for a lack of independence between the expected scoring rates of both sides. However, these flaws are both well understood and because Poisson has long been used in football prediction, these problems have been extensively addressed.
I'll assume everyone has a passing knowledge of the Poisson approach to modelling football matches, but for the casual reader, the distribution allows an estimation of the likelihood of a team scoring exactly 0,1,2,3 goals and so on given we expect that team to score and average of say 1.6 goals in such a game. To fully appreciate how we can use the Poisson approach to begin to build an in running calculator we first need to grasp the concept of goal expectation.
When we say that a side has a goal expectation of 1.6 goals, we are saying that if today's game were to be repeated over and over again, the average number of goals we would expect our team to score would be 1.6. Sometimes they wouldn't score at all, sometimes they would score 6. The most likely outcome would be a score of exactly one, followed by two. But over a long period of repeats, the average would trend towards our best estimate of 1.6.
The most important thing we need to appreciate is how this goal expectancy decays over the 90+ minutes of a match. The average 1.6 goals per game figure decays because of time elapsed. Goals already scored or conceded may tweak the average slightly in one direction or another as a result of competing, scoreline dependent, tactical rearrangements, but a glut of early goals doesn't significantly alter our pregame goal expectancy.....only the passage of time can do that.
The rate at which a team's goal expectancy declines isn't constant. More goals are scored on average in the second half than the first as teams become more urgent in their efforts to score and fatigue leads to more space. The rates are around 44% for the former and 56% for the latter and the decay can be adequately described by an exponential equation of the following form.
Remaining Goal Expectancy = Initial Goal Expectancy x (Proportion of Time Remaining) ^0.84
Imagine Stoke is expected to score an average of 1 goal in a particular match, West Ham away on Monday night, perhaps. By halftime when the proportion of time remaining is very close to 0.5, the remaining goal expectancy can be calculated by inserting these values into the previous formula to give
Remaining Goal Expectancy = 1 x (0.5)^0.84 = 0.562 of a goal.
0.562 of a goal, you may notice equates to 56% of the initial goal expectation of 1 goal, which nicely fits the observed data. We can repeat this calculation for any minute of the match and also for the opposition. Armed with this information we are just a few repetitive, but simple steps away from being able to describe the likely scoring combinations that will occur in the remainder of the contest.
We'll fast forward to the 80th minute to use this accumulated knowledge to begin to construct a flexible and realistic "in running" prediction model. The West Ham/Stoke game was a fairly common type of Premiership contest, where two reasonable well matched sides were separated on the night by little more than home field advantage. An average expectation at kickoff for Stoke would be that they'd score close to one goal and concede just over 1.4 of a goal to the Hammers. If we insert those numbers into our equation and allow for the likely 4 minutes of added time we could expect Stoke to average 0.22 of a goal to West Ham's 0.30 in the remainder of the match.
If we now fire up the Poisson calculator we can produce probabilities that Stoke and WHU will score exactly 0,1,2,3 goals and so on, in the last 10+ minutes of Monday's game. Those probabilities are listed below.
The Likelihood of Stoke or WHU Scoring an Exact Number of Goals after the 79th Minute.
| Team. | 0 Goals. | 1 Goal. | 2 Goals. | 3 Goals. | 4 Goals. |
| WHU. | 0.737 | 0.225 | 0.034 | 0.003 | 0.000 |
| Stoke City. | 0.806 | 0.174 | 0.019 | 0.001 | 0.000 |
We can now begin to accumulate the score combinations that will lead to a final match outcome, bearing in mind that O'Brien had equalised Walters' opening goal for the visitors and the match was currently stalemated. If, as actually happened, neither side scores, the match ends as a draw and the probability of a 0-0 is given by multiplying 0.737 by 0.806 or the individual probabilities of each side failing to score. That outcome has a probability of 0.594 or around 3 times in every 5. A 1-1 in the final "mini" match will also ultimately lead to a draw, as would a 2-2, 3-3 or 4-4 for the optimistic thrill seekers. If we finally total each of these individual, correct score probabilities, we have the likelihood of the currently tied game ending so at the final whistle.
A similar process generates cumulative probability totals for each correct score that leads to either a City win or a happy Hammers victory.
The Likelihood of Stoke or WHU Gaining any Result from 1-1 after the 79th Minute.
| Team. | Win. | Draw. | Loss. |
| WHU. | 0.22 | 0.63 | 0.15 |
| Stoke City. | 0.15 | 0.63 | 0.22 |
The above example is conveniently simplified by a current scoreline of 1-1, but teams can both trail or lead as WHU and Stoke respectively did in this match. However, the process merely becomes slightly more tedious rather than more complex. Stoke's set piece prowess finally reached ground level in the 13th minute when Walters found space in front of decoy runners to crisply dispatch a precisely delivered Whelan corner, an inventive deviation from the Delap assists of old. So if we want to examine the likely match result from say the 34th minute we have to also account for the 1-0 lead held by Stoke.
In this game situation, should Stoke go on to "win" the mini match from the 34' onwards, they will bolster their lead and comfortably win the game. In addition, if they merely "draw" the remainder of the match they will also win the entire game because of the 1-0 lead given to them by their mustachioed striker. An actual draw requires WHU to "win" the next 60 minutes by a single goal or by two or more to claim all three points.
The Likelihood of Stoke or WHU Gaining any Result from 0-1 after the 33rd Minute.
| Team. | Win. | Draw. | Loss. |
| WHU. | 0.16 | 0.25 | 0.59 |
| Stoke City. | 0.59 | 0.25 | 0.16 |
As the scoreline becomes more lopsided, the combinations that ultimately lead to wins, losses or draws also becomes more diverse. A team which holds a 2 goal cushion can afford to "lose" the remainder of the contest by a single goal and still claim victory. So the totting up procedure becomes more tiresome, although a spreadsheet helps greatly, but the Poisson process on a suitably decayed goal expectation remains constant.
As has already been stated, this quick run through does not account for well recognised deficiencies in using Poisson to describe football goal scoring, nor does it allow for the small, but real emphasis shifts that occur as the scoreline changes, but we can test the model's validity by comparing it's predictions to the efficient Betfair betting markets.
Below I've plotted the near 100% book prices that were available on Betfair in two minute intervals, along with the predictions from a pure Poisson during Monday night's Stoke West Ham match.
Price & Probability Movements During Stoke's 1-1 Draw At WHU.


Scorers.
0-1,Walters, 13'
1-1, O'Brien, 48'
The Betfair prices and the pure Poisson track each other's progress fairly accurately. The under prediction of the draw, inherent in the Poisson is well seen up until the WHU equaliser and my allegiance to one of the two side may also be represented throughout by my choice of initial goal expectations. Also the slightly increased optimism towards WHU during the half hour where they trailed isn't captured by the "blind" Poisson, but is by the Betfair traders and is also present in actual data.
Tuesday, 20 November 2012
Mark Hughes' Perfect Storm.
It's no great secret that football managers generally part company from their teams when on field results fail to match a Chairman's expectations. In this guest post I look at the average performance recorded by sacked managers in the recent past and the level of success a team may reasonably expect to achieve based on their preseason investment.
To read the full post follow this link .
To read the full post follow this link .
Monday, 19 November 2012
Expected Points Graph for Fulham v Sunderland.
Fulham 1 Sunderland 3.
Fulham enjoyed a particularly favourable 2011/12 in terms of red cards. Dismissals aren't very common events, but they do have a considerable effect on individual matches and possibly across seasons. Fulham didn't see red once last term, but they found themselves playing against reduced numbers on four occasions and that imbalance had the potential to gain them around two extra league points over the course of the season.
When we are dealing with such small sample sizes, it's unlikely that Fulham would be able to sustain their impeccable behaviour in a league where the base rate for red cards is just over 3 per team per season. Teams can influence their disciplinary record, but there is also likely to be an amount of randomness associated with marginally mistimed tackles, so the base rate for cards is probably as influential as a side's individual recent record.
Fulham manager, Martin Jol believes that his skipper, Brede Hangeland was unlucky to be shown red against Sunderland, further reasoning the the dismissal was very costly to his side. Hangeland may have slipped just prior to his two footed tackle, so Jol may have a point. He's certainly correct when he bemoans the cost of the card which came just 31 minutes into the match and was the equivalent of his full strength side conceding a goal. Stoke fans will also be disappointed as the Hangeland will now miss Fulham's trip to the Britannia on Saturday and they will be deprived of the opportunity to watch The Cottagers' influential skipper in the flesh.

Scorers.
31', Hangeland, Red Card.
51', Fletcher, 0-1
62', Petric, 1-1
65', Cuellar, 1-2
71', Sessegnon, 1-3
Sunday, 18 November 2012
Injury Time, Substitutions & Goal Celebrations.
Injury time, stoppage time or " the fourth official has indicated there will be a minimum of four minutes time allowed" as it is usually described by the stadium announcer at The Britannia is one of the most contentious decisions made by the referee on match day. If your side is trailing, five minutes is never enough to compensate for the interminable time spent by the opposition while taking throws or goal kicks, while three minutes is a fantasy of an official's biased mindset if you are holding a tenuous one goal lead.
The Laws of the Game hand all of the cards to the referee in the stoppage time debate. Time can be added for time lost due to substitutions, assessment and removal of injured players, time wasting and any other cause. Just in case final point didn't adequately convey the free hand afforded the referee in deciding the amount of stoppage time, the law ends by informing it's readers that "time lost is at the discretion of the referee".
Substitutions are the most readily available data points and the least open to individual refereeing interpretation. Nowhere in the Laws of the Game is a specific amount of allowed time mentioned to compensate for a substitution, but 30 seconds has almost universally become an accepted figure. Similarly, the time added, post goal scoring, to allow the players time to perform a choreographed celebration has also semi officially been set at 30 seconds and presumably falls, along with streakers and escaped dogs under the final catch all reason of "any other cause".
We are therefore left with injury assessment and removal, and time wasting as two relatively unknowable causes of stoppage time. The first is difficult to record and is at the discretion of the official and the second is almost entirely at the referee's discretion and also appears to be score and team dependent. Has a player ever been booked for time wasting, late in game when his team is trailing in the match regardless of the time he dallies over a free kick ?
Creating models that describe footballing events where some important factors are missing isn't unusual, often perfectly useful constructions can be produced using limited inputs. So, using data from the MCFC data dump I've tried to predict the average amount of injury time a team could expect to experience during the 2011/12 season using only the number of goals and the number of substitutions that occurred in total during their matches.
Use of substitutes varied quite markedly across different teams in 2011/12, Newcastle, Norwich, Everton and Manchester City were among the sides which made full use of their replacements during the season, while Fulham and Blackburn were much more reluctant to ring the changes. Each of these sides featured at the extremes for total match substitutions,with higher overall numbers also being seen in games featuring Arsenal and Wigan and lower numbers involving Liverpool and Sunderland matches.
The amount of goal scoring is easier to categorize. Teams at either end of the table generally experience contests with more goals, partly as a result of the top sides recording wide margin wins against the strugglers. Mid table outfits, on average see less goal laden matches. During the present century games played by the top six have seen an average of 103 goals a season, compared to 102 for the bottom six and just 96 for the eight teams in between.

The correlation between average stoppage time and seasonal total match goals and total match substitutions is significant. Above I've plotted the average stoppage time per game against the predicted time derived from a regression for all other teams that uses the two inputs of goals and substitutions. The majority of teams congregate around the line of best fit, but an obvious outlier is Blackburn. They averaged just under 360 seconds of total injury time per game, despite their predicted total from the amount of goals and substitutions in their matches implying that they should have received considerably less.
The reason is fairly easy to spot. Junior Hoillet was stretchered off following an injury time clash of heads with Fulham's Mark Schwarzer in their 1-1 draw leading to 11 minutes of second half injury time compared a budgeted for three. Those "extra" eight minutes spent assessing and dealing with an injury contribute 13 seconds per game that aren't accounted for in the model. Once we start to account for another obvious contributing factor such as disproportionately large amounts of time lost due to treating injuries, the line of best fit moves more in line with reality and Blackburn cease to be such an extreme outlier.
Unsurprisingly, over a season, the number of game goals, substitutions and injury stoppages appear to be good predictors of stoppage time awarded to Premiership sides.
Of more interest are the predictions spat out by the regression as the number of goals increase. Increased numbers of substitutions lead to more stoppage time, but increased goals over the season actually decreases the amount of stoppage time awarded with substitutions held constant. The data used in the regression has been aggregated over a season, so this trend may not carry over to future seasons or down to individual matches, but it's tempting to speculate that referees are implementing their version of the "mercy rule".
Games with lots of goals are more likely to be one-sided compared to games with fewer scores. Adding less stoppage time than is merited when one team reaches the 90th minute with a three or more goal advantage will hardly ever change the ultimate result. As a ballpark example, an underdog trailing 3-0 to the likes of Manchester United will take something from such a game under 1 time in 100,000 if offered 6 minutes of injury time, 1 in 38,000 if we extend it to 10 minutes. So a perhaps unconscious effort is being made by referees to put already beaten teams, prematurely out of their misery, knowing that the trailing side is almost certainly beyond hope.
The second half of United's 8-2 trouncing of Arsenal saw 6 goals, one dismissal and 5 substitutions, but just three minutes of stoppage time, although in reality a further 23 extra seconds were actually played. Similarly, Wigan 0 Arsenal 4 contained 2 second half goals, a full pack of substitutions and just 2 minutes of advertised stoppage time.
If the best and the worst sides are seeing games prematurely ended, this may explain why both Manchester clubs, along with relegated Bolton, finished in the bottom three for allotted stoppage time in 2011/12, although the often repeated conspiracy theory that the best get more time only when they need it will require more individual game data, hopefully in future posts.
The Laws of the Game hand all of the cards to the referee in the stoppage time debate. Time can be added for time lost due to substitutions, assessment and removal of injured players, time wasting and any other cause. Just in case final point didn't adequately convey the free hand afforded the referee in deciding the amount of stoppage time, the law ends by informing it's readers that "time lost is at the discretion of the referee".
Substitutions are the most readily available data points and the least open to individual refereeing interpretation. Nowhere in the Laws of the Game is a specific amount of allowed time mentioned to compensate for a substitution, but 30 seconds has almost universally become an accepted figure. Similarly, the time added, post goal scoring, to allow the players time to perform a choreographed celebration has also semi officially been set at 30 seconds and presumably falls, along with streakers and escaped dogs under the final catch all reason of "any other cause".
We are therefore left with injury assessment and removal, and time wasting as two relatively unknowable causes of stoppage time. The first is difficult to record and is at the discretion of the official and the second is almost entirely at the referee's discretion and also appears to be score and team dependent. Has a player ever been booked for time wasting, late in game when his team is trailing in the match regardless of the time he dallies over a free kick ?
Creating models that describe footballing events where some important factors are missing isn't unusual, often perfectly useful constructions can be produced using limited inputs. So, using data from the MCFC data dump I've tried to predict the average amount of injury time a team could expect to experience during the 2011/12 season using only the number of goals and the number of substitutions that occurred in total during their matches.
Use of substitutes varied quite markedly across different teams in 2011/12, Newcastle, Norwich, Everton and Manchester City were among the sides which made full use of their replacements during the season, while Fulham and Blackburn were much more reluctant to ring the changes. Each of these sides featured at the extremes for total match substitutions,with higher overall numbers also being seen in games featuring Arsenal and Wigan and lower numbers involving Liverpool and Sunderland matches.
The amount of goal scoring is easier to categorize. Teams at either end of the table generally experience contests with more goals, partly as a result of the top sides recording wide margin wins against the strugglers. Mid table outfits, on average see less goal laden matches. During the present century games played by the top six have seen an average of 103 goals a season, compared to 102 for the bottom six and just 96 for the eight teams in between.

The correlation between average stoppage time and seasonal total match goals and total match substitutions is significant. Above I've plotted the average stoppage time per game against the predicted time derived from a regression for all other teams that uses the two inputs of goals and substitutions. The majority of teams congregate around the line of best fit, but an obvious outlier is Blackburn. They averaged just under 360 seconds of total injury time per game, despite their predicted total from the amount of goals and substitutions in their matches implying that they should have received considerably less.
The reason is fairly easy to spot. Junior Hoillet was stretchered off following an injury time clash of heads with Fulham's Mark Schwarzer in their 1-1 draw leading to 11 minutes of second half injury time compared a budgeted for three. Those "extra" eight minutes spent assessing and dealing with an injury contribute 13 seconds per game that aren't accounted for in the model. Once we start to account for another obvious contributing factor such as disproportionately large amounts of time lost due to treating injuries, the line of best fit moves more in line with reality and Blackburn cease to be such an extreme outlier.
Unsurprisingly, over a season, the number of game goals, substitutions and injury stoppages appear to be good predictors of stoppage time awarded to Premiership sides.
 |
| Too little, too much ? |
Games with lots of goals are more likely to be one-sided compared to games with fewer scores. Adding less stoppage time than is merited when one team reaches the 90th minute with a three or more goal advantage will hardly ever change the ultimate result. As a ballpark example, an underdog trailing 3-0 to the likes of Manchester United will take something from such a game under 1 time in 100,000 if offered 6 minutes of injury time, 1 in 38,000 if we extend it to 10 minutes. So a perhaps unconscious effort is being made by referees to put already beaten teams, prematurely out of their misery, knowing that the trailing side is almost certainly beyond hope.
The second half of United's 8-2 trouncing of Arsenal saw 6 goals, one dismissal and 5 substitutions, but just three minutes of stoppage time, although in reality a further 23 extra seconds were actually played. Similarly, Wigan 0 Arsenal 4 contained 2 second half goals, a full pack of substitutions and just 2 minutes of advertised stoppage time.
If the best and the worst sides are seeing games prematurely ended, this may explain why both Manchester clubs, along with relegated Bolton, finished in the bottom three for allotted stoppage time in 2011/12, although the often repeated conspiracy theory that the best get more time only when they need it will require more individual game data, hopefully in future posts.
Thursday, 15 November 2012
How Do Red Cards Affect A Football Match?
A look at last season's red card winners and losers. It's not just about how many cards you take, it's also about when you take them and if you can induce your opponents to see red. A sending off costs a team points in the longrun, so ill discipline loses your team prize money and can ultimately may even threaten their Premiership position.
Follow this link for my guest post.
Follow this link for my guest post.
Tuesday, 13 November 2012
Super Subs and Selective Cutoff Points.
Not content with calling itself home to one super sub, Manchester inducted a second on Saturday night, when Javier Hernandez, also known as Chicharito accounted for two and a half of the goals that saw off Aston Villa in a night of blood letting for footballing cliches.
First to go, depending upon you view point was the invincibility or vulnerability of the two goal lead. That was quickly followed by the ability (or not) of the best to come up with needed late goals at will and in doing so Chicharito's 87th minute winner also cemented his lot as another super sub. An early rebuttal of the 90's claim that "you'll win nothing with kids" was hastily shelved following Villa's tame second half demise.
Chicharito was inevitably hailed as a super sub throughout the press. The Daily Mail, The Express, The Independent each dedicated articles to his super sub status and The BleacherReport had to fall back on "uncategorizable" as the defining quality of such a player.
I argued here that super subs arise through a combination of recency bias, small sample size and a failure to account for the richer overall goalscoring environment in which substitutes inevitably play. But there is another selection bias that is present in the statistics that accompany these articles that almost guarantee that such a player's record as a substitute will appear to be much better than his record as a starter.
Gambling touts make extensive use of the technique of using selective cutoff points when describing their profit (or loss) record, invariably starting and/or ending their "fully verified" record with a string of winners. And model builders can also unwittingly fall foul through insufficient out of sample testing of their new toy, leading to a randomly discovered favourable cutoff point in the original sample becoming the precursor to imminent, real time failure.
In sport, the selective cutoff point is a "tool" often used to support a preconceived notion about the relative merits of two players. At it's basest you select a period of time during which Player A excelled at the metric of your choice and Player B didn't and then use this biased comparison to demonstrate that A is the superior athlete.
In this post I showed how selectively restricting the the goal scoring record of Park Ji-Sung to shots from certain distances artificially inflated the apparent difference in his shot conversion across two different seasons. Selectively setting his scoring record to include only goals scored from within 15 yards of the target included all of his goals in his "up" season, but just some of his strikes in his "down" year.
A similar thing is happening when players are being designated as super subs, although the process is almost certainly being unconsciously applied. Very few expensively bought attacking members of a top EPL team's 25 man squad wake up on a Monday morning to find they have become super subs after a barren weekend from the bench. If they've bagged two out of his teams three goals, as Chicharito did as a starter for United against Braga as recently as last month, he's even less likely to be dubbed as the new David Fairclough.
But score two out of three goals from the bench, as Chicharito did on Saturday evening or two out of two as Dzeko did against WBA at the Hawthorns and the narrative is already written....and just as importantly a biased cutoff point has been set that will guarantee an inflated strike rate from the bench to back up the story.
Understandably and apparently diligently, the super sub's club career statistics are then used. However, in combination with all the other flaws, a biased cutoff point, immediately following a game where the player has performed an outstanding and atypical example of the identifying trait, has been applied to seal the "proof".
The drip, drip of unreliable numbers gradually cements the myth.
First to go, depending upon you view point was the invincibility or vulnerability of the two goal lead. That was quickly followed by the ability (or not) of the best to come up with needed late goals at will and in doing so Chicharito's 87th minute winner also cemented his lot as another super sub. An early rebuttal of the 90's claim that "you'll win nothing with kids" was hastily shelved following Villa's tame second half demise.
Chicharito was inevitably hailed as a super sub throughout the press. The Daily Mail, The Express, The Independent each dedicated articles to his super sub status and The BleacherReport had to fall back on "uncategorizable" as the defining quality of such a player.
 |
| Chicharito. A Talented Striker. |
Gambling touts make extensive use of the technique of using selective cutoff points when describing their profit (or loss) record, invariably starting and/or ending their "fully verified" record with a string of winners. And model builders can also unwittingly fall foul through insufficient out of sample testing of their new toy, leading to a randomly discovered favourable cutoff point in the original sample becoming the precursor to imminent, real time failure.
In sport, the selective cutoff point is a "tool" often used to support a preconceived notion about the relative merits of two players. At it's basest you select a period of time during which Player A excelled at the metric of your choice and Player B didn't and then use this biased comparison to demonstrate that A is the superior athlete.
In this post I showed how selectively restricting the the goal scoring record of Park Ji-Sung to shots from certain distances artificially inflated the apparent difference in his shot conversion across two different seasons. Selectively setting his scoring record to include only goals scored from within 15 yards of the target included all of his goals in his "up" season, but just some of his strikes in his "down" year.
A similar thing is happening when players are being designated as super subs, although the process is almost certainly being unconsciously applied. Very few expensively bought attacking members of a top EPL team's 25 man squad wake up on a Monday morning to find they have become super subs after a barren weekend from the bench. If they've bagged two out of his teams three goals, as Chicharito did as a starter for United against Braga as recently as last month, he's even less likely to be dubbed as the new David Fairclough.
But score two out of three goals from the bench, as Chicharito did on Saturday evening or two out of two as Dzeko did against WBA at the Hawthorns and the narrative is already written....and just as importantly a biased cutoff point has been set that will guarantee an inflated strike rate from the bench to back up the story.
Understandably and apparently diligently, the super sub's club career statistics are then used. However, in combination with all the other flaws, a biased cutoff point, immediately following a game where the player has performed an outstanding and atypical example of the identifying trait, has been applied to seal the "proof".
The drip, drip of unreliable numbers gradually cements the myth.
Monday, 12 November 2012
The Five Best Passes During Week 4 of the Europa League.
Passes are the life blood of a football match. The vast majority of them are completed and serve to either maintain possession before a more ambitious assault is unleashed on the opposing goal or to protect a position of strength and prevent the opposition from launching an attack of their own. But it is the spectacular and ambitiously successful passes that grab most of the headlines, especially if they result in a goal scoring chance. Often the player who provides the chance shares with the scorer a substantial amount of the credit for a goal.
The amount of difficulty involved in completing a pass is dependent on many variables. Defensive pressure on both the passer and the intended target will partly determine whether or not a pass can be easily completed, as will the area of the pitch from where the pass originates and the intended destination. Players can be expected to complete the majority of passes they attempt deep in their own half, partly through lack of intensive opponent pressure and through prudent choices of intended recipients.
The longer the distance of a pass and the deeper into opposition territory and more central the target, then the more difficult it is to complete the pass. By pooling large numbers of passes from different areas of the pitch and recording success rates for these passes, we can begin to develop a model to predict how likely an average passer would be to complete a particular, individual pass.
Passes are therefore neither created equally, either in their difficulty of execution or in their influence on the outcome of a match. However, in this season's UEFA Europa League a simple five yard pass between defenders as they run time off the clock is as valuable as a 40 yard point pointed through ball to open the scoring. Please visit Wu-pass.org to read about the initiative to provide a day of schooling for young people, worldwide.
The campaign is supported by Western Union and world footballing legend Patrick Vieira.
To support the program, I've used my passing model described here to quantify the five most difficult passes that led directly to goals during week four of the Europa League. As is traditional I'll list the five in reverse order.
Number 5, Diego Capel, Sporting Lisbon (vs Genk).
Capel's assist was typical of the kind of low percentage pass that can bring high rewards. The penalty area is quite naturally well defended and to create an inviting chance often requires pin point accuracy to drop the ball close enough to the six yard box to increase the chances of a goal, but not close enough to invite the keeper to claim an easy catch. Breaking down the right wing, he chose to cut back onto his left foot to provide an inswinging far post cross for van Wolfswinkle. That gave him more margin for error in finding his striker, but required his team mate to put most of the power onto the header. An excellent fast counter attacking goal from a team who were down to ten men at the time.
Number 4. Szabolcs Huszti. Hannover (vs Helsingborgs).
A constant feature of difficult passes is that they are aimed into the penalty area from distance and Huszti's lofted outswinging delivery was a perfect example of the art. The aerial route reduces the number of potential defensive interventions, but increases the amount of time defenders and keepers have to converge on the ball....unless the ball is hit with pace. The harder the ball is hit, the less accurate it becomes, but Huszti executed direction and pace to perfection.
Number 3. Fininho. Metalist Kharkiv (vs Rosenborg) .
Fininho started this goal build up with a neat nutmeg out on the left wing. This was the longest crossfield ball so far, but it was hit wingwards and towards the right hand edge of the box, an area that was likely to be less populated by defenders than the heart of the penalty box. It was partly an attempted assist and partly a ball designed to change the point of the attack. Taison had stayed wide to accept the pass and the defense drifted out to meet him. However, instead of controlling the ball, he smashed an unstoppable shot high into the net from an narrowing angle. Not quite the most difficult pass on show on Thursday, but by some way the most unlikely goal.
Number 2. Gareth Bale. Tottenham Hotspur (vs Maribor).
Another excellent left footed delivery from the flanks. Bale took advantage of a momentary stumble by the Maribor defender. But he still had to curl the ball around his desperate, attempted recovery and find Defoe's feet, central to the goal and at the edge of the six yard box with great accuracy. The pace of the ball also meant that Defoe merely had to steer the ball into his choice of corners with the keeper tempted, but powerless to intervene.
The Top Five Passes from Europa League, Week Four.
Drum roll....
Number 1. Ryan Donk. Club Brugge (vs Newcastle).
The wide margin winner for the pass of the round. Pass completion is made easier if the recipient can create a passing angle for the passer, either through movement or by inviting the pass to be made into space. Diagonal running makes for an easier pass and conversely passing when the passer, defender and striker are almost perfectly in line significantly increases the tariff.
Donk had 10 Newcastle players in front of him, Trickovski deep and a defender directly in line when he attempted a pass resembling a desperation Hail Mary from the NFL. His margin for error was tiny. Under hit the ball and a defensive clearance was an almost certainty, over hit the pass and the keeper/sweeper came into play.
.PNG)
The ball had to land perfectly in stride to be collected by Trickovski's vertical run, but the execution was precise and the rewards were large when the striker arrived at the edge of the box, in a central position with the Newcastle defence all behind him, save for an exposed keeper, who he duly beat.
An outstanding pass, a fine finish and a worthy winner.
The amount of difficulty involved in completing a pass is dependent on many variables. Defensive pressure on both the passer and the intended target will partly determine whether or not a pass can be easily completed, as will the area of the pitch from where the pass originates and the intended destination. Players can be expected to complete the majority of passes they attempt deep in their own half, partly through lack of intensive opponent pressure and through prudent choices of intended recipients.
The longer the distance of a pass and the deeper into opposition territory and more central the target, then the more difficult it is to complete the pass. By pooling large numbers of passes from different areas of the pitch and recording success rates for these passes, we can begin to develop a model to predict how likely an average passer would be to complete a particular, individual pass.
Passes are therefore neither created equally, either in their difficulty of execution or in their influence on the outcome of a match. However, in this season's UEFA Europa League a simple five yard pass between defenders as they run time off the clock is as valuable as a 40 yard point pointed through ball to open the scoring. Please visit Wu-pass.org to read about the initiative to provide a day of schooling for young people, worldwide.
The campaign is supported by Western Union and world footballing legend Patrick Vieira.
To support the program, I've used my passing model described here to quantify the five most difficult passes that led directly to goals during week four of the Europa League. As is traditional I'll list the five in reverse order.
Number 5, Diego Capel, Sporting Lisbon (vs Genk).
Capel's assist was typical of the kind of low percentage pass that can bring high rewards. The penalty area is quite naturally well defended and to create an inviting chance often requires pin point accuracy to drop the ball close enough to the six yard box to increase the chances of a goal, but not close enough to invite the keeper to claim an easy catch. Breaking down the right wing, he chose to cut back onto his left foot to provide an inswinging far post cross for van Wolfswinkle. That gave him more margin for error in finding his striker, but required his team mate to put most of the power onto the header. An excellent fast counter attacking goal from a team who were down to ten men at the time.
Number 4. Szabolcs Huszti. Hannover (vs Helsingborgs).
A constant feature of difficult passes is that they are aimed into the penalty area from distance and Huszti's lofted outswinging delivery was a perfect example of the art. The aerial route reduces the number of potential defensive interventions, but increases the amount of time defenders and keepers have to converge on the ball....unless the ball is hit with pace. The harder the ball is hit, the less accurate it becomes, but Huszti executed direction and pace to perfection.
Number 3. Fininho. Metalist Kharkiv (vs Rosenborg) .
Fininho started this goal build up with a neat nutmeg out on the left wing. This was the longest crossfield ball so far, but it was hit wingwards and towards the right hand edge of the box, an area that was likely to be less populated by defenders than the heart of the penalty box. It was partly an attempted assist and partly a ball designed to change the point of the attack. Taison had stayed wide to accept the pass and the defense drifted out to meet him. However, instead of controlling the ball, he smashed an unstoppable shot high into the net from an narrowing angle. Not quite the most difficult pass on show on Thursday, but by some way the most unlikely goal.
Number 2. Gareth Bale. Tottenham Hotspur (vs Maribor).
Another excellent left footed delivery from the flanks. Bale took advantage of a momentary stumble by the Maribor defender. But he still had to curl the ball around his desperate, attempted recovery and find Defoe's feet, central to the goal and at the edge of the six yard box with great accuracy. The pace of the ball also meant that Defoe merely had to steer the ball into his choice of corners with the keeper tempted, but powerless to intervene.
The Top Five Passes from Europa League, Week Four.
| Team. | Minute. | Scorer. | Passer. | Chance Of Pass Being Completed. | Chance Of Pass Being Converted. |
| Club Brugge. | 14 | Trickovski. | Donk. | 22% | 16% |
| Tottenham. | 22 | Defoe. | Bale. | 35% | 18% |
| Metalist Kharkiv. | 4 | Taison. | Fininho. | 35% | 2% |
| Hannover. | 3 | Diouf. | Huszti. | 38% | 21% |
| Sporting Lisbon. | 64 | Wolfswinkle. | Capel. | 39% | 11% |
Drum roll....
Number 1. Ryan Donk. Club Brugge (vs Newcastle).
The wide margin winner for the pass of the round. Pass completion is made easier if the recipient can create a passing angle for the passer, either through movement or by inviting the pass to be made into space. Diagonal running makes for an easier pass and conversely passing when the passer, defender and striker are almost perfectly in line significantly increases the tariff.
Donk had 10 Newcastle players in front of him, Trickovski deep and a defender directly in line when he attempted a pass resembling a desperation Hail Mary from the NFL. His margin for error was tiny. Under hit the ball and a defensive clearance was an almost certainty, over hit the pass and the keeper/sweeper came into play.
.PNG)
The ball had to land perfectly in stride to be collected by Trickovski's vertical run, but the execution was precise and the rewards were large when the striker arrived at the edge of the box, in a central position with the Newcastle defence all behind him, save for an exposed keeper, who he duly beat.
An outstanding pass, a fine finish and a worthy winner.
Friday, 9 November 2012
Edin Dzeko Is Not a Super Sub.
Super sub is an uneasy and often unwelcome crown to wear, with the juxtaposition of a superlative with a faint hint of failure. Liverpool's David Fairclough provided the benchmark by which all other lethal replacements are measured, making his name in the late 70's and early 80's during an era when domestic substitutes were singular and always wore the number twelve shirt. 37 goals from 92 starts and 18 from 62 from the bench hint at the lopsided nature of his goalscoring exploits that ensure he is fondly remember by football fans from the seventies and not just on Merseyside. Ultimately his misfortune was to straddle the careers of first Toshack and Keegan and then Dalglish and Rush.
The attractive narrative of the super sub is easy to appreciate. Dramatic match winning strikes live long in the memory and most substitutes manage to stay on the pitch to feature in many such goals. Ole Gunnar Solskjaer's 93rd minute winner against Bayern Munich in the Nou camp in 1999, twelve minutes after his introduction. Fairclough's reputation making winner in the 84th minute against St Etienne in an earlier incarnation of the same competition and Moses' late header a few days ago are just a few such efforts that understandably eclipse the much more numerous failed substitutions. "Not so super sub" doesn't quite have the same headline appeal.
Bosnian, Edin Dzeko is the current poster boy for the super sub with an eye catching recent run of scoring form from the bench, combining quantity with game changing late strikes. You can read a typical appreciation of Dzeko's supposed qualities on the BT Footballing Website written by journalist Rob Smyth.
Helpfully the statistics appear to back up the narrative that Dzeko is much more effective as a late, game changing introduction rather than as a starter. He's made over 40 starts for Manchester City since his arrival, comprising over 3,700 playing minutes during which he's scored 19 times at a rate of a goal every 195 minutes. Contrast this with his forays from the bench when his 30+ substitute appearances, lasting just over 600 minutes has yielded 12 goals at a rate of a goal every 52 minutes.
Undeniable evidence ?
Unfortunately, the evidence fails on two crucial counts. Firstly, "super sub Dzeko" is playing in a very different goals scoring environment than is "starting Dzeko". Scoring in football becomes almost imperceptibly more frequent as a match progresses, with 45% of the goals coming before the interval and 55% after half time. We can demonstrate these different scoring environments by looking at a typical breakdown of goals for the first ten minutes of an EPL game (when "starting Dzeko" will almost certainly be on the field) and the final ten minutes (when "super sub Dzeko" will be present).

The first ten minutes is more likely to be goalless than the last ten and the former is also significantly less likely to contain exactly one or two goals than is the final ten minutes of a game. As a substitute, Dzeko averaged 18 minutes per game, so he was consistently playing when goal scoring was approaching a peak, not just for him but also for the team as a whole. Therefore, to look at his scoring exploits from the bench within the context of his scoring environment we need to compare his scoring record with that of Manchester City as a team for the time he was on the pitch as a substitute. And also repeat the exercise for Dzeko as a starter.
| Goals By Dzeko As A Starter. | Total City Goals Over Same Timescale. | Goals By Dzeko As A Sub. | Total City Goals Over Same Timescale. |
| 19 | 74 | 12 | 32 |
| 26% of Total. | 37% of Total. |
Initially the evidence still appears strong, although not quite as extreme as the figures based on raw minutes per goal in Dzeko's role as a starter and as a sub . As a substitute Dzeko scores 37% of the goals that City score while he is present in that role, but just 26% when he starts. However, we are now faced with a second problem if we try to take these figures at face value. Dzeko's super sub status is based on just 600 minutes of playing time, a fifth the size we've used to measure his scoring rate as a proportion of City's overall record as a starter. And small samples often lead to extreme, but unreliable estimates.
Dzeko's 600+ minutes as a sub is almost exactly equivalent to the number of minutes he played as a starter in his first eight games of the 2011/12 season. During those matches he scored 7 of the 17 goals recorded by City, 41% of their goals. A number in excess of his super sub strike rate, but a poor indicator of his career figure of 26% based on a larger sample size. If his hot start to 2011/12 wasn't indicative of his career figures, shouldn't his 37% strike rate as a sub, collected under very similar playing time also carry a caveat ?
Dzeko obviously doesn't relish the tag of "Super Sub", but the good news is that sample size and differing goal environments indicate that he probably isn't one anyway (even if they exist). In fact for a more extreme example of the "art", he need merely look across his own attacking line to Sergio Aguero, who has scored over 50% of his team's goals as a substitute on an even smaller sample size of 300 minutes.
In short, City have an embarrassment of attacking riches and if you cut the sample small enough extreme results are bound appear. Add a persuasive narrative and you've recreated a long lost story from the seventies.
Thursday, 8 November 2012
Shot Analysis Of Manchester City 2 Ajax 2.
48 hours after Manchester City failed to beat Ajax in the second match of their Dutch double header, Champions League fixture and the inquest into City's "failure" continues unabated. However, as in politics, football can occasionally predict what they wish for rather than what they suspect may happen.
The more prolonged and league based the contest, the more likely it becomes that the best teams will make it through to the very latter stages of the competition and the hybrid league/knockout format of the UCL goes part way to assisting the progress of the better sides in Europe's premier competition. However, it is the initial group seeding process that most helps the giants of European club football and as Simon Gleave brilliantly demonstrates in his latest tweets from the Scoreboard Journalism blog, City have been handed an extremely tough task as fledgling European campaigners.
The UK betting industry may have been immune to the "Mitt" factor, calling Barack as a 80%+ favourite before the polls closed, but they have undoubtedly included a small patriotic premium in their view of City's chances in a far from straightforward Group D. Leading to an inflated overall expectation for the 2011/12 English champions.
Entwining the relative merits of different leagues from different countries has become easier as the scope of European club competition has rapidly expanded. Interlocking formlines between the likes of Chelsea and Barcelona can be readily extended to the lesser lights of the Premiership, who can only dream of entertaining the Catalan giants on a wet Wednesday night somewhere in the Midlands, but regularly compete against Chelsea. It is therefore a small step to equate the talent levels of Ajax with those of Everton or at a push an under performing Arsenal.

Scorers.
11', de Jong, 0-1
17', de Jong, 0-2
22', Ya Ya Toure, 1-2
74', Aguero, 2-2.
Notwithstanding the high, if unrealistic hopes for City in the competition, they were quite rightly favoured to beat Ajax on Tuesday night at the Etihad. However, they suffered a dramatic reversal of roles as two close range de Jong strikes, one with his foot and one with his head gave the visitors similar expected points levels to those enjoyed by their hosts at kick off. A Toure goal bought the teams to within touching distance almost immediately and then the clock ticked in Ajax's favour as each team enjoyed bouts of possession dominance.
Aguero levelled the match with around 20 minutes of playing time remaining, but a stalemate was now much more likely than it had been at the start and despite the understandable exposure given to Baloteli's dramatic fall in the box after 93+ minutes, it's possible that the game was even over when the "foul" was committed. Certainly a team which relies on a last kick penalty for a win hasn't made full use of the previous 94 minutes.
The Likelihood of Shots from the Manchester City/Ajax UCL Game Resulting in A Goal.
Looked at through shot statistics, a draw may have been a fair outcome. Each side managed about a dozen attempts, but many were from distance and as such were likely to be successful around one time in 20.
De Jong was the star performer for Ajax, scoring twice and also topping the number of attempts for either side. He got on the end of the two clearest chances of the night and converted both of them, although he also benefited from a reluctance from the City defence to mark him at set pieces or close him down from distance. The projected success rates for shots accounts for pitch position, but at the moment averages the likely defensive pressure. So, and as visual evidence confirms, de Jong's chances were slightly easier than the generic probabilities imply.
De Jong's first goal came courtesy of a deflected attempt from Moisander. The defender's header was itself a solid chance from a corner and can be recorded as either an assist or an opportunity, but it does highlight the particular problems City had when defending corners early in Tuesday's game. Although to draw permanent defensive traits from such little evidence is perhaps premature.
His second strike also demonstrates the difficulty of defending headers from inside the six yard box as discussed here. City certainly erred by losing de Jong in the box, but it's unlikely that a defender on the post would have had any more joy at preventing the goal than Joe Hart had armed with the advantages of being the keeper. As a further aside, corner takers who "fail to beat the first man" are actually trying to hit the area of maximum reward, an area so ruthlessly exploited by de Jong. So criticism of their failure should be tempered by knowledge of their intentions.
Ya Ya Toure pulled a goal back with the game's third most likely opportunity, so a night of fluctuating fortunes came about because chances that were most likely to produce a goal actually did produce goals.
Aguero's equaliser again demonstrates the need to begin to assess the impact of defenders on shot probability. He had all of Ajax's defenders behind him when he took his shot from just inside the box, compared to the more likely scenario where such attempts have to navigate their way through a crowded penalty box. He also profited from Vermeer adopting the occasional Jan Jongbloed approach to shot stopping. In short Aguero's chance almost certainly had a higher likelihood of success than the average effort from that distance.
Cumulatively the reasonably large number of chances created by each side is diluted by the large number of attempts being from distance. City, as you would expect given that they were both at home and trailing for large portions of the match accumulated a higher goals expectation, but Ajax almost matched them through higher chance quality and an effective counter attacking tactic, especially later on in the game.
If this game was mindlessly played out time and time again on a spreadsheet, with no regard for current score and using the shooting data as the basis for your model, City would win 42% of the reenactments, Ajax 26% and 32 % of the matches would end in the same outcome as Tuesday night's actual reality.
The more prolonged and league based the contest, the more likely it becomes that the best teams will make it through to the very latter stages of the competition and the hybrid league/knockout format of the UCL goes part way to assisting the progress of the better sides in Europe's premier competition. However, it is the initial group seeding process that most helps the giants of European club football and as Simon Gleave brilliantly demonstrates in his latest tweets from the Scoreboard Journalism blog, City have been handed an extremely tough task as fledgling European campaigners.
The UK betting industry may have been immune to the "Mitt" factor, calling Barack as a 80%+ favourite before the polls closed, but they have undoubtedly included a small patriotic premium in their view of City's chances in a far from straightforward Group D. Leading to an inflated overall expectation for the 2011/12 English champions.
Entwining the relative merits of different leagues from different countries has become easier as the scope of European club competition has rapidly expanded. Interlocking formlines between the likes of Chelsea and Barcelona can be readily extended to the lesser lights of the Premiership, who can only dream of entertaining the Catalan giants on a wet Wednesday night somewhere in the Midlands, but regularly compete against Chelsea. It is therefore a small step to equate the talent levels of Ajax with those of Everton or at a push an under performing Arsenal.

Scorers.
11', de Jong, 0-1
17', de Jong, 0-2
22', Ya Ya Toure, 1-2
74', Aguero, 2-2.
Notwithstanding the high, if unrealistic hopes for City in the competition, they were quite rightly favoured to beat Ajax on Tuesday night at the Etihad. However, they suffered a dramatic reversal of roles as two close range de Jong strikes, one with his foot and one with his head gave the visitors similar expected points levels to those enjoyed by their hosts at kick off. A Toure goal bought the teams to within touching distance almost immediately and then the clock ticked in Ajax's favour as each team enjoyed bouts of possession dominance.
Aguero levelled the match with around 20 minutes of playing time remaining, but a stalemate was now much more likely than it had been at the start and despite the understandable exposure given to Baloteli's dramatic fall in the box after 93+ minutes, it's possible that the game was even over when the "foul" was committed. Certainly a team which relies on a last kick penalty for a win hasn't made full use of the previous 94 minutes.
The Likelihood of Shots from the Manchester City/Ajax UCL Game Resulting in A Goal.
| Player. | Minute. | Goal Probability. | Outcome. |
| Eriksen. | 3 | 0.03 | Blocked. |
| Aguero. | 5 | 0.05 | Off Target. |
| Zabaleta. | 7 | 0.12 | Off Target. |
| de Jong. | 10 | 0.25 | GOAL. |
| Nastasic. | 11 | 0.09 | On Target. |
| de Jong. | 17 | 0.21 | GOAL. |
| Ya Ya Toure. | 22 | 0.15 | GOAL. |
| Zabaleta. | 30 | 0.11 | On Target. |
| de Jong. | 33 | 0.01 | Off Target. |
| Boerrigter. | 37 | 0.02 | Off Target. |
| Ya Ya Toure. | 39 | 0.13 | On Target. |
| Nastasic. | 50 | 0.11 | Off Target. |
| Ya Ya Toure. | 53 | 0.03 | Blocked. |
| de Jong. | 56 | 0.02 | On Target. |
| Eriksen. | 62 | 0.04 | Off target. |
| Barry. | 65 | 0.04 | Off Target. |
| de Jong. | 71 | 0.04 | On Target. |
| Aguero. | 73 | 0.06 | GOAL. |
| Baloteli. | 79 | 0.13 | On Target. |
| Dzeko. | 79 | 0.05 | Off Target. |
| de Jong. | 84 | 0.06 | Off Target. |
| Kompany. | 86 | 0.07 | Off Target. |
| Eriksen. | 91 | 0.04 | On Target. |
| Fischer. | 92 | 0.07 | Off Target. |
| Manchester City | Cumulative Expected Goals. | 1.1 | |
| Ajax. | Cumulative Expected Goals. | 0.8 |
Looked at through shot statistics, a draw may have been a fair outcome. Each side managed about a dozen attempts, but many were from distance and as such were likely to be successful around one time in 20.
De Jong was the star performer for Ajax, scoring twice and also topping the number of attempts for either side. He got on the end of the two clearest chances of the night and converted both of them, although he also benefited from a reluctance from the City defence to mark him at set pieces or close him down from distance. The projected success rates for shots accounts for pitch position, but at the moment averages the likely defensive pressure. So, and as visual evidence confirms, de Jong's chances were slightly easier than the generic probabilities imply.
De Jong's first goal came courtesy of a deflected attempt from Moisander. The defender's header was itself a solid chance from a corner and can be recorded as either an assist or an opportunity, but it does highlight the particular problems City had when defending corners early in Tuesday's game. Although to draw permanent defensive traits from such little evidence is perhaps premature.
His second strike also demonstrates the difficulty of defending headers from inside the six yard box as discussed here. City certainly erred by losing de Jong in the box, but it's unlikely that a defender on the post would have had any more joy at preventing the goal than Joe Hart had armed with the advantages of being the keeper. As a further aside, corner takers who "fail to beat the first man" are actually trying to hit the area of maximum reward, an area so ruthlessly exploited by de Jong. So criticism of their failure should be tempered by knowledge of their intentions.
Ya Ya Toure pulled a goal back with the game's third most likely opportunity, so a night of fluctuating fortunes came about because chances that were most likely to produce a goal actually did produce goals.
Aguero's equaliser again demonstrates the need to begin to assess the impact of defenders on shot probability. He had all of Ajax's defenders behind him when he took his shot from just inside the box, compared to the more likely scenario where such attempts have to navigate their way through a crowded penalty box. He also profited from Vermeer adopting the occasional Jan Jongbloed approach to shot stopping. In short Aguero's chance almost certainly had a higher likelihood of success than the average effort from that distance.
Cumulatively the reasonably large number of chances created by each side is diluted by the large number of attempts being from distance. City, as you would expect given that they were both at home and trailing for large portions of the match accumulated a higher goals expectation, but Ajax almost matched them through higher chance quality and an effective counter attacking tactic, especially later on in the game.
If this game was mindlessly played out time and time again on a spreadsheet, with no regard for current score and using the shooting data as the basis for your model, City would win 42% of the reenactments, Ajax 26% and 32 % of the matches would end in the same outcome as Tuesday night's actual reality.
Subscribe to:
Posts (Atom)