Pages

Monday 14 May 2018

Non-Shot xG Passing Stats. The Complete Picture.


The 2017/18 Premier League season is now a wrap and you’ll be bombarded with end of season advanced stats, both team based and for individuals.

Mostly, these figures will largely confirm what we intuitively know. 

Kevin De Bruyne may not have come close to Mo Salah’s goal output, both actual and expected, but he contributed massively to Manchester City’s creative avalanche with outrageous passing ability.

The gradual advent of pass based, non-shot expected goals models is beginning to highlight the contribution of those creative players who often provide the raw material for the scorers to bask in the celebratory spotlight.

However, many of these interpretations have exclusively concentrated on the positive contributions made by attempting to advance the ball, while ignoring the cost when a player’s misplaced pass leads to a turnover.

Possession comes with responsibility as well as opportunity and while a completed pass rightly causes an uptick in expected goals fortunes for a side and a player, there is always a price to pay if the ball instead ends up at the feet of the opposition.

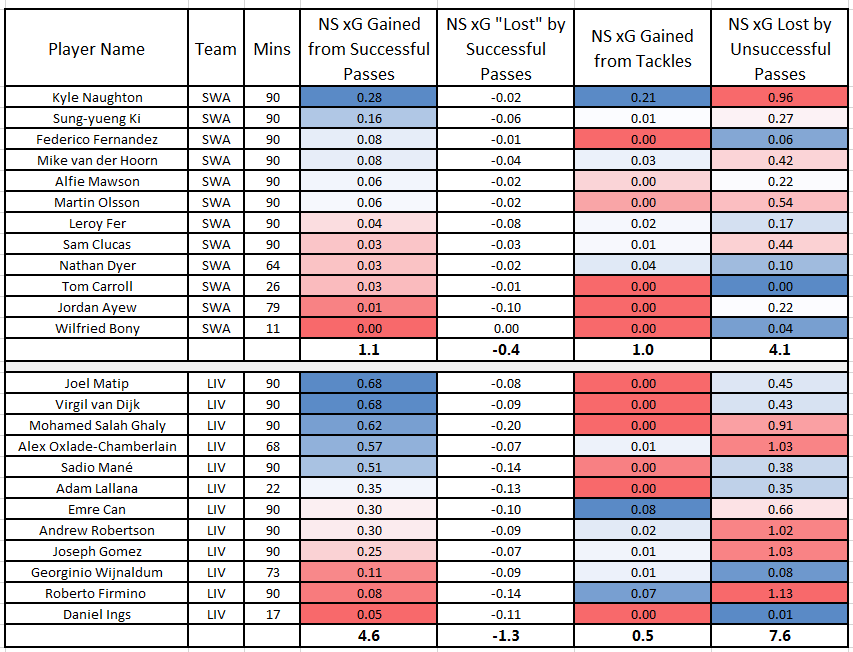
Infogol’s non-shot passing model gives an expected goals figure to every possible possession location on the field of play, but it will be different from the perspective of the two teams.

Possession on the edge of your own box will be worth very little in terms of non-shot expected goals, but would be hugely valuable if possession switched to your opponents.

So a misplaced pass that turns over possession deep in your own half will lose your side the tiny expected goals valuation that went along with that possession, but will also hand a much larger chunk of NS xG to your rivals.

The cost of losing that possession would be significant.

Similarly, lose possession deep in your opponents half and you are conceding the hard won NS xG owned by progressing deep into opposition territory and you’ll also hand a small amount of NS xG associated with opposition possession in their own half.

Just as we can tally the positive contributions made by players, we can also see what their misplaced passes cost their side.

It is inevitable that KDB will lose possession for his side in valuable areas, it is the natural cost of the high tariff passes he often attempts, but ignoring these entries in the debit side of the creative ledger omits the realistic representation of football as experienced by those who watch the full 90 minutes rather than just the highlight reel.

To give a flavour of the much more rounded picture NS model can convey, here’s a breakdown of the percentage of team passing creativity owned by players from the 2017/18 season, but also balanced by the percentage of team NS xG lost by misplaced passes that belong to the individual.

Top 10 Defenders.


Bottom 10 Defenders


Top 10 Midfielders


Bottom 10 Midfielders


Top 10 Strikers (+ Wayne).


Bottom 10 Strikers


Here’s the top and bottom 10 list of players that compares the amount of good things their passes have contributed against the times when their passing radar has gone astray.

They’ve been sorted by position, because the opportunity to create or make mistakes is largely driven by where you play. I’ve also compared the player’s importance to his side.

For example, Aaron Cresswell’s passes has contributed 17.5% of West Ham’s total positive change in non-shot xG and he has been responsible for 10.5% of the NS xG the Hammers have lost due to misplaced passes.

At the other end of the scale, Benteke’s passes has contributed 2.7% of Palace’s positive NS xG from passing, but he’s given away 10.3% of his side’s total generosity to their opponents.

I’ve included Rooney as a striker just to give him a suitable Premier League send off.

Wednesday 2 May 2018

Non-Shot xG Models

This blog's been rather quite of late, mainly due to my writing over at Pinnacle, alongside working since 2016 as the Football Product Manager at Timeform, a analytics, content & data company.

So while the bulk of my output appears on these two sites, TPoG does give me the chance to prime some of the new stuff we've developed.

This week on the Infogol site, we revealed the work we've been doing to develop a non-shot xG model. The post can be read HERE

NSxG isn't a new concept, the idea's been around in other sports, such as the NFL for decades, but the fluid nature of football/soccer has made such models very data hungry & time consuming to run on a humble works computer.


I'll use this post to throw in some random thoughts about our NS xG and highlight the advantages and similarities to the more readily seen chance based xG models.

What's NS xG?

NSxG gives a value to every possession in every area of the playing field. It's most usefully expressed in expected goals and describes the likelihood that a possession will eventually turn into a goal.

If you've got the ball deep in your own half, the chance of that possession developing into a goal is tiny. If you've the ball in your opponent's penalty area, it's a lot more.

How can NSxG be Used?

In much the same way as shot based xG. namely to evaluate players and teams, but in the former case it's much more inclusive.

If you successfully move the ball from your own box to the opponents with one raking pass, you'll personally (along with the receiver) get the credit for the improvement in NSxG associated with the pass.

More realistically, if you competently move the ball ten yards upfield, you'll get a small uptick in NSxG. Do it consistently and you might even be ranked as the best at beginning deep lying moves in the Premier League.

What About Mistakes ?

There's risk and reward with every pass attempt. Unintentionally pass to the opposition instead of your deep lying playmaker and you're handing the opponents a fairly big chunk of NSxG, while giving up the small amount you owned prior to the pass.

So it can be used to Evaluate Defensive Actions? 

Yes, break up an attack with a tackle or interception and you can cost out the benefit by just summing the pre and post event NSxG for both teams.

What About Backward Passes that Find a Team Mate?

They'll lose NSxG, for the player making the pass, but they can be classified separately and might reveal the required role of the player or the tactical mode a side has slipped into, perhaps when defending a lead.

It's a harsh system that penalizes a player for taking the kick off.

Can It Only Be Used for Passes? 

No, it can be applied to any recorded action, running with the ball burns calories and gradually ticks up the change in NSxG (provided you're running in the right direction).

Who Benefits from an NSxG Model. 

Players who don't regularly provide a key pass or get onto the end of lots of chances. If you're the one breaking up the opposition's midfield passing or tasked with circulating the ball you've been bypassed by attacking event based expected goals.

NSxG shows everyone what you do

Can You Show That Players or Teams Over or Under Perform a NSxG Model?

Easily. Build your baseline model around the entire Premier League and you can estimate not only the worth of advancing the ball from A to B, but also how often an average Premier League side would expect to successfully achieve the pass or run.

Then you just see how often a particular team/player fares compared to the league average.

Is it Better than Normal xG? 

Not really better, just different. Usual xG does really well at rating teams, but less well at picking out individual contribution or mistakes.

If you've help craft a sublime move that goes the length of the pitch only for a team mate to fall over his or her own feet and lose the ball, you'd like some credit (& perhaps a black mark against your clumsy colleague, especially if he or she makes a habit of it).

Any Examples?

Here's the Liverpool 4 Manchester City 3 game from January broken down by the pass related NSxG for all the players.


There's a lot of numbers, so it's colour coded, blue is good, red is not so, although the jury is still out on the final column.

First numerical column is the cumulative increase in NSxG by each player's successful passes.

The Ox, Firmino and Mane showing up well. Gomez perhaps a surprise being so prominent? (I don't watch much Liverpool). Mo would show up more, I assume if we included the pass receiver as well, rather than just the passer.

De Bruyne unsurprisingly topping City's numbers, with Otamendi stepping up to help with the game chasing.

Next column is the NSxG "lost" by successful backward passes. Just ball re-circulation really.

Third column is the cumulative net gain through disrupting the opposition's passes. The Ox was definitely up for it that day.

Last column's a bit of a conundrum. It's NSxG lost by a player through misplaced or broken up passes.

You have to ask do you want to penalise your most talented players who try the most difficult passes, such as De Bruyne and the Ox (again).

If you don't have the red in column four, you may not have the blue in column one. Although they might ultimately harm the team by their extravagant pass choices.

It's all risk/reward and passing with purpose.

Here's a week later at the Liberty.

Liverpool losing 1-0 to Swansea.


30/70 possession in favour of Liverpool.

Liverpool's defenders stepping up to kick start many of their attacks. Lots of Liverpool passes going astray, but not particularly because of direct Swansea intervention. Ox putting in a similar performance, but Firmino struggling to find a teammate, but not for lack of trying.

Anyone shirking. Not really for me to say, substitutions included.

So Who's the Best Passing Team in the Premier League?

Manchester City.

Proof?

OK, definition of best passing side. One that makes valuable passes and completes them at well above the league average rates.

That's Manchester City.


Just a summary plot here.

We've combined the cumulative increase in NSxG with the under or over performance in the rate at which these passes are completed.

Manchester City's cumulative, successful passes increased their NSxG by 13% more than you would expect an average side to achieve if they were attempting the same passes Manchester City are inflicting on the opposition.

Huddersfield's successful passes increased their NSxG by 10% less than the average expectation if you had Mr Premier League Average doing your passing. Basically, they aren't very good at passing in areas where it matters more.