Pages

Sunday, 23 September 2012

James Milner's Passing Stats Against Bolton.

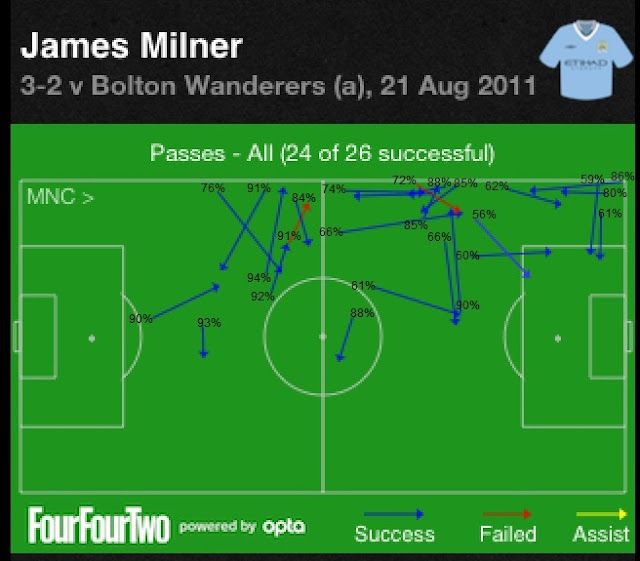
I've recorded most of James Milner's passing attempts from a screen grab of the FourFourTwo Opta powered app from Manchester City's trip to Bolton in August 2011. A game which is fast becoming the most analysed match of all time. Each pass has been assigned a likelihood of completion based around the success rates of the 1,000 or so passes made by the other 26 participating players from the fixture. The origin of each pass and the position of the intended target is the primary driving force for the calculations.

Milner's attempts have been split into three roughly 30 minute periods for no other reason than to make the plots more easily viewed. It may be that the splits show an ebb or flow of attacking or defensive intent or an increase in adventure followed by a more cautious final third. But it's easy to be wise in hindsight or see patterns that have only descriptive validity. Therefore I am merely presented the passing charts to give a feel for the estimated difficulty of a wide range of passes.

The midfielder was heavily involved in most areas of the pitch and is an excellent choice to display a varied passing repertoire. He completed an above average number of his pass attempts (53 against a predicted 47) but he was also adventurous enough to misplace 10 passes and create two goals.

Difficulty Of Milner's Passes At Bolton, KickOff Until 30th Minute. 2011/12.


Difficulty Of Milner's Passes At Bolton, 31st Minute Until 60th Minute. 2011/12.


Difficulty Of Milner's Passes At Bolton, 61st Minute Until 94th Minute. 2011/12.


The main purpose of the three graphics is to give the opportunity to eyeball a large variety of different passes and to see  if their associated completion expectations appear reasonably sensible, but on a narrower scale they also highlight Milner's contribution to City's 3-2 victory at The Reebok.

The expected increase in difficulty of completions as players move from their own goal towards their opponents is well demonstrated by the figures. Obviously the physical act of passing a ball five yards is the same wherever it is undertaken on the pitch, but the level of difficulty changes because of the environment.

Tactically few teams press high up the pitch and if they do the pressers are always outnumbered by the passers. Also, once we also acknowledge the ability of the passer to chose his pass, it's unsurprising to see most passes made entirely within a player's own half have expected success rates of mid to high 80's and above.

Based on this limited dataset passes made from the flanks towards the centre circle appear as the most risky passes made from wholly within a player's own half (although a completion is still as likely as Chelsea beating Stoke at The Bridge). These type of attempts, if intercepted presumably offer excellent counter attacking possibilities, so opponents may be prepared to gamble on an interception knowing that the risk is far outweighed by the potential reward.

The balance between passer and would be interceptor or tackler begins to become more even as the advancing player puts the centre circle behind him and length of pass and direction begins to have an impact on completion rates. Players appear to be able to comfortably circulate the ball in areas between the two arcs, but increased pass length quickly drops expectations to below coin toss levels, as does any attempt to deeply penetrate the penalty box. The best passers of the ball will be operating in these more advanced areas, but they will be faced with more numerous and more skilled tacklers and defenders. So the skill levels of the contestants both begin to rise compared to less advanced passing zones.

As noted in previous posts, passes to the flanks aren't defended as vigourously and backward passes, even from very advanced areas usually have a high incidence of success.

Data from a single game is sufficient to lay down a framework with which to begin to analyse passing outcomes. With a greatly extended database, it should be possible to begin to discern team tendencies as well as the strengths and weakness of individual players and the part they play in a team's wider passing agenda. If we can further develop the models to include the presence of defending players it may also be possible to determine if players are passing poorly because they are simply poor passers or because they are good passers who are making flawed decisions around their choice of pass.

Friday, 21 September 2012

Bolton v Manchester City. Overall Team Passing Using MCFCAnalytics Data.

In this post  I looked at the individual passing statistics for Nigel Reo-Coker during the first half of the Bolton Manchester City match from the start of last season using the xml data from MCFCAnalytics. Account was taken of the starting and finishing co ordinates for each pass made by Reo-Coker to determine the difficulty of each attempt. Comparison was then made to all the other pass attempts made on the day to see if he over or under performed compared to an overall standard. The higher the expected completion rate associated with an individual pass, then the easier it should have been to complete.


Below I've charted the passing records for each team's starting eleven from the game and compared their actual number of successful passes to the number of expected completions when the difficulty of each individual pass is accounted for. I've also listed the average difficulty of each player's attempted passes. Generally the longer the attempt and the deeper the intended target is into the opponents half of the field, the more taxing the execution. Therefore it's unsurprising to note that both keepers, who hit a disproportionate amount of long balls, overall tried to execute the most difficult passes for each side. Pass difficulty is expressed as how likely it is that the pass is completed, so the lower the figure in the "Pass Difficulty" column, the harder the pass attempt.

Passing Record Of The Bolton Starting Eleven Verses Manchester City.2011/12.

Sorted in descending order of difficulty.

Player. Successful Passes. Expected Completed Passes. Average Pass Difficulty %.
Jaaskeliainen. 21 15.3 37.3
Steinsson. 15 18.9 66.8
Knight. 14 17.5 72.8
Eagles. 29 26.5 73.5
Petrov. 35 38.4 73.8
Cahill. 21 18.8 75.1
K Davies. 19 30.2 77.4
Reo-Coker. 39 41.2 77.7
Robinson. 36 34.2 77.7
Klasnic. 25 27.5 80.7
Muamba. 13 15.7 82.5


Passing Record Of The Manchester City Starting Eleven Verses Bolton.2011/12.

Player. Successful Passes. Expected Completed Passes. Average Pass Difficulty %.
Hart. 15 18.3 52.3
Richards. 29 28.7 71.6
Milner. 52 47.0 73.2
Kolarov. 37 36.7 76.5
Dzeko 20 19.3 77.1
Silva. 61 54.1 77.3
Barry. 44 41.6 78.5
Aguero. 22 24.3 81.1
Lescott. 29 28.2 83.0
Toure. 60 53.5 83.7
Kompany. 35 33.5 83.8

The immediate stand out feature of each table is the under performance against expectation of the Bolton players and the over performance of City. Only four players from the host side beat expectations, while only Joe Hart and the recently signed Aguero fell below average. Numerically, City were also far superior in terms of passes attempted.

Passing statistics are a double edged sword because they quickly provide copious amounts of data ripe for analysis, but they also can quickly overwhelm the senses. A game map containing every pass often merges into a mass of block colour that lacks definition. Even passing wheels for individual players can soon become cluttered and confusing. Therefore in an attempt to mimic the player influence plots, I've tried to produce for each player one single pass that attempts to encompass the essence of his passing contribution in a single game. I've combined the average start and end point for each player's passes in an effort to highlight where each player is seeking to influence the game. In conjunction with the figures in the table above as well as raw passing numbers, we may be able to distill each individuals passing contribution in a few powerful numbers and graphics.

Passing Profiles For Bolton's Starting Eleven Verses Manchester City.

Passing Profiles For Manchester City's Starting Eleven Verses Bolton.


The starting position for each pass summary is denoted by the players name and the length of the line equates to the average pass length. Direction indicates whether a player is passing predominately in field or towards the flanks and in the case of central midfielders their most likely pitch position is used as the origin of the pass.

Hart and Jaaskelainen's plots are similar, but there are subtle differences that do inform. Hart's overall pass length is shorter than his Bolton counterpart and also more pronounced towards the flanks. Jaaskelainen is more route one and deeper, but his overperformance against the expected norm partly justifies this approach or at the very least reveals it as a deliberate and practiced tactic.

Overall both pairs of fullbacks attempted, on average, difficult passes. This is partly unavoidable because many of their pass attempts will have been from the restricted flanks into the more vigourously defended central areas of the pitch and they will probably be longer in length. Steinsson's attempts were generally from advanced positions, but his completion rate was poor, even after allowing for the difficulty of making a completion. However, he fared no worse than many of his colleagues.

As with the keepers, the central defenders appear similar, but Lescott and Kompany attempted much easier and shorter passes from deeper in their half compared to Knight and Cahill. They appear to be primarily defenders who pass the creative burden quickly onto teammates. The Bolton pair in contrast had a much more advanced passing position and chose to play the ball into deeper, more difficult areas. On the evidence of their expected completion rates, Cahill was much more comfortable with this approach than was Knight on this particular gameday.

Toure appears to have principally functioned as a circulator of the ball, his influence was centred around halfway and he attempted and over completed copious amounts of simple passes in a contest where City were never required to ever chase the game.

Milner, Silva and Dzeko's "typical" passes each arrow from wider to more central and advanced areas and are again in stark contrast to Bolton's creative intent where only Eagles performs a similar function. Klasnic and Kevin Davies both make more passes outwards towards the flanks, either by design or necessity. Overall an easier pass to complete, although Davies' completion rate suggests a bad day at the office for the Bolton striker.

Aguero shares with Petrov the distinction of playing the ball on average back towards his own goal albeit from a fairly advanced area of the pitch, possibly indicating an afternoon spent holding up the forward passes.

Passing data often contains much that is merely recycling the ball between players before a more decisive and effective action is attempted. Using an approach that largely cancels out much of this type of pass we can try to illustrate the main thrust of each individuals passing intent and highlight who was trying to do what on the day. By further reference to their actual success rates compared to an league average norm we can then begin to see how successful they were in those attempts, before moving onto more granular details that should highlight individual assists that may be atypical of an otherwise lacklustre showing.

Thursday, 20 September 2012

St George's Park Photographs.

I had a peek around St George's Park yesterday and took these photos. Still a lot of construction work going on, but the hotel and practice pitches are both immaculate and up and running. England women had trained the previous day on the Umbro pitch and there was an England junior rugby session taking place yesterday.

Follow the link below.


http://www.flickr.com/photos/87061400@N06/sets/72157631574919674/with/8003448634/


Wednesday, 19 September 2012

Quantifying Passing Difficulty in the EPL.

Goals and goal attempts are quite rightly the standout events that occur during a football match and their relative scarcity allows for extensive analysis to be undertaken on the easily collected data. In contrast passes are much more numerous in game events and while this gives us a much larger dataset to work with, the collection process quickly becomes much more problematic. Therefore the recently released xml data from last season's Bolton verses Manchester City Premiership match has provided an ideal opportunity to work with a substantial amount of quality passing statistics.

Analysis of passes attempted has quickly evolved from the bland overall completion figures, to area and directional subsets and is now moving towards investigations based on each individual pass. Unlike goal attempts, where the point of origin of the attempt is usually sufficient to make analysis possible, passing data also requires an intended end point. We can then incorporate these parameters into our regressions and begin to estimate an expected pass completion figure based on field position and direction and difficulty of the attempt.

Ideally this type of analysis needs to accumulated passing data from every team in the league in order to provide an average baseline for the expectancy figures. However at the moment we are restricted to using albeit extensive data from a single game. City and Bolton do have contrasting passing styles, the former ended the season as Champions, the latter were relegated, so there is a possibility that the pass expectation figures derived from the data of both teams may approximate to Premiership league average values. However, we are putting convenience above rigour at the present.

If we firstly perform a general regression that generates the likelihood that a pass will be completed using the co ordinates of the starting and end point as the four inputs, we can try to see which of the two teams was better at pass completion when account was taken of passing difficulty.

Predictably, Manchester City attempted more passes than Bolton, but they also completed more than our hoped for "average team " would complete. 427 found their target compared to a cumulative expectation of just 410 completed efforts. Inevitably, Bolton therefore appear to under perform completing 279 passes instead of an expected 295. Despite the problems associated with our methodology these conclusions aren't unexpected, as City were top of the pile in May and Wanderers were relegated on the last day of the season.

To see if City's superiority is maintained in different areas of the pitch, I've then looked at their completion rates for passes made from the final third of the pitch. The final third has universally been noted as an important area of the pitch and real danger can threaten once teams being to take control of this portion of the playing area. City are again above the norm, completing 106 of 145 such passes, where only 100 were predicted compared to Bolton's 66 from 112 and an expectation of 79. If representative over a league wide controlled dataset we see the double whammy that lesser sides face up to against the best. City make more passes from the final third than their opponents and because they have more talented players, they are also better at such passes.

Equally instructive is the record of passes made inside a line drawn parallel to the edge of the box. City made over 50 such attempted passes, completing 34 compared to an average team's expectation of 29. Bolton could only attempt 24 such tries, completing only 6 against a norm of 10.


Reo-Coker stamps his authority on the midfield.
Needless to say one game is insufficient sample size to define a player's passing abilities, but we can use similar pass expectation models to quantify how individuals performed on that particular match day and maybe hint at their overall ability. Nigel Reo-Coker anchored the Bolton midfield and captained the side over the season and is currently a free agent looking likely to continue his career in the Championship.

Below I've screen grabbed his 22 first half pass attempts from the home game with Manchester City. I've chosen the first half merely for clarity of picture. The screen grab illustrates the direction and difficulty of the passes he attempted and in the table below I've referenced each pass along with a brief description, the outcome, (1 for a success, 0 for a failure) and the expected completion rate for such passes derived from all the passes attempted by City and Bolton in the game but minus Reo-Coker's 22 first half efforts.


The cumulative completion rate expectancy was that Reo-Coker would complete 17 of his 22 passes and that's exactly the figure that he was successful with. Again if we make the not inconsiderable assumption that a combination of City and Bolton passes equate the EPL average, this would make the player an average EPL passer of the ball, but above average within that Bolton side, again consistent with his current career stage that flirted with minor international honours, but looks set to continue at a lower level.

Nigel Reo-Coker's 22 First Half Passes At Home To Manchester City, EPL 2011/12.

Pass no. Completion. Expectation%.
Notes.
1 1 82 Forward pass towards halfway.
2 1 98 Back pass to keeper.
3 1 88 Forward pass from own area.
4 1 94 Short, forward pass to flank from own half.
5 1 80 Forward pass to flank from centre circle.
6 1 94 Square ball from inside own half.
7 1 83 Short pass inside the centre circle.
8 1 80 Attacking pass to final third from halfway.
9 1 74 Square ball to central area in final 3rd.
10 0 10 Attacking pass to area from own half.
11 0 83 Forward pass towards halfway.
12 1 70 Pass from own box towards halfway.
13 0 42 Diagonal pass from halfway to area.
14 0 66 Forward pass to flank from own half.
15 1 90 Short, forward pass inside own half.
16 0 87 Short, forward pass inside centre circle.
17 1 67 Pass from final 3rd to flank. Goal buildup.
18 1 96 Backward pass from halfway.
19 1 88 Diagonal pass to flank from own half.
20 1 85 Diagonal pass to flank from own half.
21 1 84 Backward pass from inside centre circle.
22 1 88 Short forward pass from own half.


Again I'm reluctant to make any bold claims based on just 1000 passes from a single game, but some self evident features of the modern game appear to be confirmed by the various regressions. Passing the ball backwards, especially from inside your own half is a very low risk action, no doubt in most part because players will only choose to make such passes if they are supremely confident that they will retain possession.

Passing the ball infield from the flanks carries a greater risk of an incompletion, partly due to the touchline restricting choice and allowing tacklers to jump the pass and lastly passing the ball forward, especially from the final third into central areas of the pitch becomes much more difficult, again for obvious reasons.

Reo-Coker's passing timeline illustrates some of these overall features. Each of his incompletions came on attempted forward passes, three of which were among the longest he made and therefore also carried the largest chance of failing to reach their intended target. The vast majority of passes had a completion expectation of 80% or above indicating that player passing evaluation certainly requires an input that considers the difficulty of the passes attempted rather than being based solely around completion percentages. Had Reo-Coker been less adventurous he would have inflated his completion rate, but as pass 17 illustrates he would likely have hurt his team overall.

Reo-Coker's most noteworthy pass of the half was number 17, not only did it carry a relatively high level of risk, it was made from around the final third to the flanks, traveled a fair distance and it set up Petrov to supply the cross for Klasnic to score Bolton's opening goal, allowing the hosts to remain competitive throughout the match.

Sunday, 16 September 2012

Shot Analysis Of Bolton v Manchester City, 2011/12.

Manchester City, Bolton Wanderers, Gavin Fleig and Opta have recently released advanced level data for the 2011/12 early season game at the Reebok, between the two respective sides. The data provides a play by play account of the game, where each action throughout the match is described in minute detail. The most important addition to the earlier aggregated data release is the inclusion of the so called x, y co ordinates which allows a degree of context to be introduced to any analysis. Inclusion of pitch position and also game state begins to make it possible to begin to quantify the importance of major in game events and investigate more thoroughly each team's differing intentions during various stages of a match.

One of the most readily identifiable match event is attempts on goal and the new data release enables such chances to be quantified. Potentially this adds insight to the events on the day and reveals an extra layer of information to supplement the previous performance indicators based solely around goals and match result.

Anticipating the level of expected superiority between two opponents in a low scoring sport such as a football match is difficult. The average number of goals scored per game in the Premiership hovers around 2.5 goals and even in the biggest of mismatches when top play bottom, the superior side is on average rarely more than two goals superior to their opponents. Home sides on average are around four tenths of a goal superior to average away sides, but it's difficult to make a "goals only" judgement on either of these mythical side's performances if the game ends in say a single goal win for the home side.

By quantifying each chance created, especially with regard to how likely each chance was to produce a goal, we can begin to look at overall performance rather than performance based merely on result.

Manchester City visited Bolton on week two of the 2011/12 season, both had opened their campaign with 4-0 wins, City at home to Swansea and Bolton away at QPR. However, a more accurate estimation of the respective merits of each side could be found in their records from the previous year. Two average Premiership sides from that season, meeting at a neutral venue again and again would have shared around 2.8 goals on average. Therefore, Bolton's overall record of 52 goals scored and 56 conceded marked them down as a slightly below average attack and a below average defence, fully consistent with their finishing position of 14th. In contrast, Manchester City's 60 goals for and just 33 against indicated above average ability at both disciplines, again fully consistent with a finishing spot of 3rd and combined with £80 million gross purchases, it signaled an anticipated springboard for a title ascent in 2011/12.

Ground advantage would tweak the balance back towards the hosts, but City would expect to win this type of matchup by an average of around eight tenths of a goal over many repetitions. An average goal expectancy of 1.7 goals for the visitors and 0.9 for the hosts, equating to a win expectancy of 55% for the aspiring champions was in line with most pre game predictions.

The actual result, 3-2 to City reflects as accurately as it can the expected difference in ability between the two sides, but twice as many goals were scored compared to the average outcome from such a meeting. Therefore it may be more instructive to roll the scoring process back one step to see if the performances of each team was fairly typical of such matchups and the actual result was simply a less likely, but not prohibited outcome. A Manchester City side with sights on the title would record a 3-2 victory at a team such Bolton around once in 40 visits.

                      Quality Of Bolton's Goal Chances At Home To Manchester City, 2011/12.


Bolton created and attempted seven goalscoring chances and they are arranged in chronological order in the table above. The colour coding represents the percentage chance that each shot would, be on target (blue), blocked (gold) or result in a goal (brown). The first attempt, a free kick from Eagles that Hart palmed away came as early as the third minute. In order of likelihood, this particular attempt could have missed the target, been blocked or been on target. The distance and angle of the free kick made it a longshot that a goal would result directly from the kick. Bolton started the match brightly, but didn't manage another attempt following Kevin Davies' 63' effort that bought the game to it's final 3-2 scoreline.

Around half of the attempts represent genuine scoring opportunities. The two chances that fell to Davies, one of which he converted and their opening goal that was scored by Klasnic were each likely to result in a goal between 15 and 25% of the time. Others, notably Eagles' attempts were more speculative.

An average attacking side presented with the seven chances that fell to Bolton would reap an average return of around eight tenths of a goal. That's a figure that was very close to Bolton's pre game expected goal average based on their attacking prowess and City's defensive ability from the previous year. So the slightly more extensive shot data is telling us that Bolton's attack performed largely to expectations and it was to the credit of the strikers that they turned an expected eight tenths of a goal's worth of chances into two actual goals. On another day they may have drawn a blank.

                                  Quality Of Manchester City's Goal Chances Away To Bolton, 2011/12.


City not only produced many more goal attempts than did their hosts, 18 compared to seven, but they also carved out twice as many genuine scoring chances. Milner, Aguero, Dzeko, Silva and late on as Bolton sought an equaliser, Tevez and Johnson each had opportunities that were the equal or better of the host's best. It's noteworthy, rather than a repeatable team trait, that City scored their goals from three of the more unlikely opportunities that fell to them in August last year. Much better chances were created but failed to produce a goal, further indicating the random component that exists when the talent being exercised has success rates that seldom vary much above 1 in 4 and often fall a lot lower. Skill and randomness, two forces that ensure the best team doesn't always grind out a win, especially in a relatively low scoring sport.

As with the Bolton example we can, in lieu of grouping together similar matchups, compare the outcome expectation from the 18 shots rather than relying on the smaller three goal sample as an indicator of performance. If we again concentrate on the "goals for" column we find that the 18 shots would yield on average just over two goals. Again this is close to the value of the Manchester City pregame goal expectation derived from historical records for both teams.


                      How Cumulative Expectation Compared To Reality.

Team. On Target Shots. Blocked Shots. Goals.
Bolton Cumulative Total. 2.6 1.5 0.8
Bolton Actual Total. 3 2 2
Man City Cumulative Total. 6.6 4.0 2.1
Man City Actual Total. 7 33

In short, both teams had created chances that over the long term would yield the kind of average scoreline that we would have predicted for a clash between the Bolton and Manchester City teams of the previous 30 + games. The goal glut materialized partly because of the uncontrolled order at which chances are converted into goals in a highly competitive arena. On another day a similar range and quality of chances could lead to few in any goals. A 1-0 victory for the visitors should be played out on average once every eight such trials, even with shots arriving at a rate of one every four minutes.

The Five Chances That Were Converted In The Bolton Verses Manchester City Match.

Goal Scorer. On Target % Blocked % Goal %
Silva 27 30 4
Barry 27 35 5
Klasnic 43 17 19
Dzeko. 41 16 10
Davies, K 42 20 16

Analyzing shots is a fertile ground for investigation and the addition of pitch position enhances any conclusions. As a descriptive and analytical tool it can be used to explain the match scoreline or in a wider, more extensive context to highlight teams or players who consistently under or overperfom against the norm. Just as importantly, a deeper understanding of how chances become goals can help to show that even seemingly elevated levels of scoring actually flow naturally from in game events.

Tuesday, 11 September 2012

Game Graphs for Bolton V Manchester City, 2011/12.

Here's the in running fluctuations from last year's early season game between Bolton and Manchester City. From an expected points viewpoint, Bolton kept ahead of the curve for the first twenty minutes, but once City took the lead they remained strong favourites to take all three points.....Not sure why I suddenly decided to post this particular game ;-)


Scorers.
26', Silva, 0-1.
37', Barry, 0-2.
39', Klasnic, 1-2.
47', Dzeko, 1-3.
63', Davies, 2-3.


Saturday, 8 September 2012

Newcastle's 2011/12 "Lucky" Season.

There's little doubt that Newcastle's 2011/12 season was a huge success for both the players and management. They finished five points and one place shy of the fourth place that in any typical year would have guaranteed Champions League football at the historic Sports Direct Arena. Their success was built on an impressive strike force of Cisse and Ba and a tactical approach that largely shunned possession, while remaining pleasing on the eye.

It's therefore understandable that many should take issue when their lofty finishing position is attributed to luck. Much of the debate revolves around a confusion of terminology. Luck implies a reward reaped by someone, whether deserving or not, through events that they have no ability to influence and that doesn't really seem to apply wholly to the results of a series of football matches. Cisse's wonder goal against Chelsea at the tailend of last season certainly appeared to have a component of luck about it, but there was no doubting the skill involved in striking a ball with such venom and swerve, while also avoiding a severe dislocation of the right knee.

So how should we define luck in sporting contests ? Again a coin analogy is the best starting point. A fair coin has the talent to land on heads 50% of the time, but that doesn't mean that in every 4 tosses, two win be heads and two tails. The rate at which a coin displays it's "talent" only becomes apparent after a much larger number of trials and the proportions of heads begin to trend towards 50%. The distribution of successful tosses in much smaller runs will jump about alot, sometimes hitting lots of heads, giving the appearance of being in form and sometimes not. That's all part of the random nature of events.

The same randomness that prevents a coin from continually alternating between a head and a tail is also present during a football match. It pays to have the best talent available to you, but if your star striker lines up a last minute spot kick where history tells you he converts such chances at a rate of 78%, he cannot guarantee you a goal. His success rate would have to be a bona fide 100% for that to be the case.

If penalties are to be missed you would prefer them to be missed 86 minutes into a 6-0 romp, rather than in the last seconds of a stalemate, but the random component of a skill means that you are largely powerless to ensure that the best case scenario always happens. Being skillful is plainly good, but being skillful and have random manifestations of that skill fall in a fortuitous pattern, (as may have happened at Newcastle) is an extremely potent mix.

One way to look at how "randomly blessed" Newcastle were in 2011/12 is to look at the high and low points from each game during the season. Games states are constantly changing, usually only slightly by dint of time elapsing and sometimes dramatically through goals or red cards and at any point in a match a team will have an associated points expectation derived from their likelihood of winning or drawing the game. By looking at these highs and lows we can better see what the average seasonal up and downside was for a side. One of the biggest swings against Newcastle came at home to Wolves. Leading 2-0 going into the 50th minute, the home team would average 2.95 points from that position, but at full time their points expectation had collapsed to 1.

Newcastle's High & Low Points During Each 2011/12 Game.

Opponent. Highest Points Expectation Lowest Points Expectation.
Arsenal. 1.07 1
@Sunderland. 3 1.09
Fulham. 3 1.92
@QPR. 1.23 1
@Aston Villa. 1.06 0.30
Blackburn. 3 2.24
@Wolves. 3 1.25
Tottenham. 1.25 0.18
Wigan. 3 1.45
@Stoke. 3 1.02
Everton. 3 1.60
@Man City. 0.61 0
@ Man Utd. 1 0.13
Chelsea. 1.11 0
@Norwich. 1.29 0
Swansea. 1.90 1
WBA. 1.72 0
@Bolton. 3 1.25
@Liverpool. 1.56 0
Man Utd. 3 0.83
QPR. 3 1.79
@Fulham. 2.11 0
@Blackburn. 3 1.36
Aston Villa. 3 1.43
@Tottenham. 0.54 0
Wolves. 2.95 1
Sunderland. 1.65 0.15
@Arsenal. 1.39 0
Norwich. 3 1.81
@WBA. 3 1.21
Liverpool. 3 1.23
@Swansea. 3 1.23
Bolton. 3 1.59
Stoke. 3 1.88
@Wigan. 1.41 0
@Chelsea. 3 0.63
Man City. 0.95 0
@Everton 1.16 0
Actual Points Total. Best Case Average. Worst Case Average.
65 83 31.5


The first point to make is that these game states are purely theoretical. You can't take 1.16 points from a single game against Everton. But if you replayed enough scenarios from that particular game state, then your average points haul would be around 1.16 points. So by summing the various game states to get a best and worst case points total we have combined both real and theoretical points totals. It is a useful device to get an average indication for what might have occurred had the cards fallen more or less kindly for Newcastle last term.

If everything had gone right last year, Newcastle could have probably secured Champions League football with an average of 83 points. Their actual points haul in each "lucky" season would be centred around 83 points, even  including the slimmest of slim possibilities that they may have won all 38 games.

Of much more relevance to the 2012/13 Magpies is the range between last year's best and worst case scenarios. The mid point is 57 points compared to their actual total in 2011/12 of 64. Might the 57 points be a better indication of what Newcastle "should" have got during last season's campaign and might that be a better indication of what a luck neutral Toon side may achieve this term ?

We can repeat the process for Chelsea, the team who finished just behind Newcastle, but are legitimate title contenders and top four constants, as well as being the current holders of the Champions League trophy.

Chelsea's Best & Worst Case Averages for 2011/12.

Actual
Points For Chelsea.
Best Case
Points Average.
Worst Case
Points Average.
64 93 45

Chelsea's best and worst case averages are over 10 points above Newcastle's respective totals, despite the London side gaining one less actual point than Newcastle and their midpoint is 69 points. So despite finishing line abreast with Newcastle, "in game" situations may indicate that bad luck, much of it self inflicted may have prevented Chelsea from gaining a more representative 69 points. 

Perhaps tellingly,current points projections for 2012/13 have Chelsea ending the campaign with 74 points and Newcastle with just 54, numbers that are closer to their expected midpoints from last year than their actual figures recorded in May.

Every team experiences random variation from their true ability over a short 38 game season and a team which finishes just outside the top four and isn't part of the EPL's major six sides has very likely benefited from some good fortune combined with excellent play. 

Further supporting evidence is present in the records of teams who finish just out of the top four positions. Over Premiership history, the average goal difference for sides finishing 5th to 8th who aren't one of Man Utd, Man City, Chelsea, Arsenal, Liverpool or Spurs is plus 7. The average points total is just over 58 and the average finishing position is 6.6. In the following season, average goal difference drops to minus 3, points total is 50 and finishing position is 11th. Four such teams were actually relegated and 75% of them recorded lower final points totals. So the overwhelming evidence is for a return to earth following an over achieving season previously.

If Newcastle of 2012/13 manage to breach even the 50 point barrier, they will have bucked a very strong trend.


Wednesday, 5 September 2012

How Teams Win from the MCFC Data.

The data released by MCFC, Opta and Gavin Fleig has now been out in the wild for a couple of weeks and it has already been put to good use both in graphical form and as the basis for game by game analysis, most notably by Ravi Ramineni at Analyse Football .

The data as presented in the csv file largely describes the actions made by players in a game. For example the number of forward passes made by Salif Diao for Stoke at the Emirates. One, as it happens. It is therefore a fairly simple task to accumulate match data comprising the total number of forward passes made by Stoke on that day against Arsenal. Once again Ravi's suggestion regarding the use of pivot tables in excel or Datapilot in Open Office is an excellent one.

We can therefore begin to build up a profile of the actions made by teams during games and try to marry these actions to game result to build up a picture of how teams achieve  the results they do. This aim can be best achieved by looking at the stats differential between both teams in the match. Goals are strongly correlated to game success, but as Blackpool discovered, you must also be proficient at preventing goals. The defensive and preventative side of the game can often be overlooked, even though it has a similar level of importance in determining match outcome. In short it is goal difference that is the stronger indicator of success or failure compared to simply goals scored.

Below I've listed the strength of correlation between success over a season as measured by wins plus half draws divided by games played and various recorded events from the MCFC data and then I've listed the correlation between success and event differential. The closer the correlation is to 1.0, then the stronger the correlation.

How Match Events And Their Differentials Correlate With Seasonal Success.

Match Event. Correlation
With Seasonal Success.
Goals Scored. 0.78
Goals Scored/Allowed Differential 0.94
Shots On Target. 0.60
Differential. 0.73
Headed Goals. 0.03
Differential. 0.27
Goals From Corners. 0.27
Differential. 0.45
Successful Passes ex Crosses. 0.54
Differential. 0.54
Successful Final 3rd Passes 0.62
Differential. 0.65
Touches In Opponents Box. 0.56
Differential. 0.73
Shots On Target Inside Box. 0.57
Differential. 0.73


As it's simplest level the differential column now includes the defensive contribution to winning instead of merely the offensive output. Scoring goals on it's own is a major factor for success for a lot of the Premiership teams, but a stronger correlation can be found if we included goals allowed as well. By presenting the wider picture of events we can begin to understand how free scoring Blackpool spent just one season in the top flight and barely scoring Stoke have survived since 2008/09. Concentrating on having a strong defence can be both cost effective and successful and a partial antidote to a lacklustre attack.

The figures, which are far from exhaustive, outline the kind of things the majority of the successful teams excel at over a season. However, care must be taken to avoid making broad statements that do not apply to all teams. Those teams which adopt tactical approaches that are at odds with the majority of other teams will inevitably be flagged up as outliers who have been incredibly fortunate to survive, when in reality they have exploited a niche market that has allowed them to prosper.

Headed Goals...A vital contribution for some teams.


One particularly striking result is the apparent zero correlation between headed goals and success followed by only a slight improvement if we look at the differential between headed goals scored and headed goals allowed. However, if we dig a little deeper, rather than being a worthless artifact of a bygone age, headed goals are actually vital to a minority of teams.

Scoring headed goals is a much cheaper, if less efficient method of moving the scoreboard than taking the ground route. You can create headed chances with little more than tall attackers or defenders and a delivery system, (long throws, set pieces or crosses). Creating Barca style goals from intricate passes usually requires expensive skill throughout the midfield and attacking areas. So headed goals are vital to the prospects of Stoke and Norwich and previously Bolton and Blackburn. These teams make the best of their meagre resources, but are in the minority in prioritizing headed goals both scored and conceded and therefore cannot greatly influence the regression correlation.

Aggregated game stats can shed some light on the type of things some teams are doing and are allowing to be done to themselves over the course of a season. But the picture is broad and sweeping and much fine detail is lost due to lack of game position context and tactical approach of some teams over a season.

By looking at differentials we can strengthen the correlations between season long success, so lastly I'll look at how success as measured by individual wins on a game by game basis relates to positive on pitch actions for each team. Are these broad correlations observed on match day?

Final 3rd completions are widely regarded as the preferred tactical approach for the majority, but not all teams. So it seems reasonable that if this approach is effective, teams will be winning more often if they complete passes in their opponents final 3rd and limit their opponents in this area. Regressing differentials for final 3rd passing, we do find a clear and strong game by game correlation for the EPL as a whole last season. Below I've plotted the line of best fit for final 3rd differentials and the likelihood that the home team won the match.


For example if the home side out passed their opponents by 50 passes in a game, there was a 50% chance that they also won the game and the greater the differential the greater the likelihood that they also won the game. Correlation doesn't imply causation, but it does strengthen the case for final 3rd passes being an important component of some team's armoury. There will of course also be exceptions in this game by game analysis with Stoke, certainly and Newcastle, possibly plotting a different route through a tactical independence from the majority of the rest of the league where the importance of final 3rd completions is diminished.