Pages

Thursday, 29 August 2013

Cardiff Shoot Down Manchester City

The most memorable victory of Stoke's inaugural Premiership season took place on the last day of January 2009. A single goal home victory against a Manchester City side managed by Mark Hughes and yet to really flex their new found monetary muscle, may not appear as an obvious high point for a side that also took the bigger scalps of Spurs and Arsenal. But the manner of the 1-0 win epitomized a season.

Reduced to ten men after half an hour, when Delap saw red for first fouling Wright-Philips in full gaze of Martin Atkinson and then smacking the ball at the prostrate City player for good measure, Stoke scored the game's only goal just before the crowd adjourned for halftime pies. Manchester City's inability defend a high ball to the edge of the six yard box was all the encouragement James Beattie required and a raucous crowd, that spawned a myth, saw Stoke home for their first win in 11 long matches.

Judged from the sofa and from testimony from those I know who were there, the more opulent, current version of Manchester City, suffered a similar aerial mugging in a loud and proud stadium in Cardiff on Sunday afternoon.

Provocatively dressed in red, both for the City fans and also for a sizeable minority of their own supporters, the Bluebirds lifted themselves from an even bigger hole than the one faced by Stoke four and a half years ago. Dzeko's 52nd minute opener was cancelled out by Gunnarsson and then well and truly eclipsed by two headed Campbell goals from corners. Negredo's injury time consolation merely held back any early leavers intent on beating the traffic.

Cardiff's classic rearguard action, where territory was ceded, but bodies flooded the defensive third and pressure was relived towards the isolated attacking pace of Bellamy, was a familiar sight for Stoke fans used to Tony Pulis' preferred method of play. But having fallen behind, Cardiff had to go to another Potteries staple, namely the set piece.

Paradoxically, corners should be relatively easy to defend, but if a side can engineer or are allowed a free header from close range, the quality of the opportunity is often excellent.

                                      Cardiff's Attempts on the Manchester City Goal.


                                         Manchester City's Attempts on the Cardiff Goal.


City's possession dominance also gave them a 16-9 shot advantage, but what Cardiff lacked in quantity, they made up for in quality. Nearly half of their opportunities came inside the six yard box, compared to just one, off target injury time effort from Negredo for the visitors.

However, if we sum the goal likelihoods for each side's created chances, City edge back ahead with a expected goal supremacy that is nearly half a goal in front of Cardiff's. The expected situation becomes even less favourable for the hosts if we look closer at each shot.

Gunnarsson's equalising goal came about immediately following Campbell's saved effort from similar close range. It is to Cardiff's credit that they had players ready to react quicker than City's defenders, so they should potentially benefit from creating two such high quality chances inside the six yard box. But, although the caveat that an altered, preceding shooting outcome would inevitably alter the course of the game for any subsequent shot applies to any simulation, it is most keenly apt in the case of follow up efforts.

In short, Cardiff are entitled to score once from either Gunnarsson or Campbell's near simultaneous efforts, but not twice. Therefore, in any simulation, I've allowed that if Campbell scores with the initial shot, Gunnarsson can not repeat the feat a second later.

Simulated Match Outcomes Based on Quality and Quantity of Shots.

Team. % of Sims Won. % of Sims Lost. % of Sims Drawn.
Cardiff City. 26.5 45.5 28
Manchester City. 45.5 26.5 28

Manchester City had a torrid time defending corners. Their poor play began simply by allowing Cardiff an opportunity, especially from such close range. But they also failed to exert any kind of defensive pressure on Campbell when he did evade his markers twice in ten minutes. Once those failures had kicked in, Campbell's likelihood of scoring probably eclipsed the generic, average conversion rates for headers inside the six yard box.

Nevertheless, on a straight reading of the chances created, Cardiff were still lucky winners on the day, despite their excellent, but likely unsustainable accuracy and conversion rates. They probably created enough late game chances to average a one goal return, but managed three and just a third of their shots probably should have required a save, rather that the two thirds in reality.

Manchester City would have won nearly half of the outcomes had they been decided by a repetitive shooting contest and in the reality of the day they failed to take advantage from actually taking a lead on Sunday from one of their least likely opportunities. 

A Cardiff win was the minority outcome from a shot based simulation, but Cardiff will take heart from  a performance that overall belied the expected pregame supremacy that most experts granted to their opponents. Manchester City had an estimated 67% chance of winning prior to the Cardiff City Stadium kicking off their home Premiership adventure.

Manchester City will wonder if defeat was merely down to a bedding in period for a change from zonal to man for man corner marking and will take scant comfort from a likely virtual victory in light of a real life, points costing, defeat.

Tuesday, 27 August 2013

Stoke 2 Crystal Palace 1. A Shot Analysis.

Crystal Palace's visit to the Britannia Stadium pitted together two of the favourites for a return to Championship football in time for the 2014/15 season. As one of the promoted sides, Palace's position is understandable, especially with the loss of Zaha to the champions, Manchester United and an elevation that came by way of the playoffs. Their chance of an immediate return is currently rated around the 70% mark.

The experts are less confident in the prospect of Stoke slipping back down the pyramid come May. In contrast with the pessimism surrounding Saturday's recent opponents, the Potters currently enjoy the considered consensus of a 75 to 80% chance of remaining in the top flight. That number still makes them fourth favourites to be one of the three relegated sides. A sign of the uncertainty surrounding a new manager in Mark Hughes, a seismic change in style and the competitiveness of the lower reaches of the Premiership, rather than an acknowledgement of Stoke as an established EPL team.

So the match on Saturday was an early season opportunity for potential strugglers at the lower end of the table to pick up valuable points, while guaranteeing none for their likely rivals. A nervous 90 minutes awaited both sets of fans, especially Stoke's, who as the home side were reasonably strong pregame favourites and had a manager whom, as a high profile pundit explained "hadn't won a Premiership game since January" (total sample size, one match, away at Anfield).

With the week's marque matchup taking place on Monday night at Old Trafford and the remainder of Saturday's Premiership entertainment providing less than riveting viewing, Stoke's 2-1, come from behind victory appeared second on Match of the Day. As is usual in such truncated highlights, most of the action featured the goals and various goal attempts from each side and initial impressions appear to show that Palace might consider themselves unlucky losers on the balance of attempts.

                                                 Stoke Attempts on the Palace Goal.


                                                 Palace Attempts on the Stoke Goal.


Both sides had 14 attempts on goal with each side requiring the other to make an intervention to a goal bound shot on 5 occasions. So was Stoke outscoring Palace by 2 to 1, not only an absurd use of ratios, but also a fortunate outcome for The Potters and would a share of the spoils been a more appropriate final outcome?

The use of shots and headers to determine the fairness of an actual result is rife with flaws and contradictions. A side tailors their attacking approach to the current game state and that usually means more goal attempts when that state is an unfavourable one. So shot numbers are a function of what actually happened and in which order, on the day. Also a different outcome for one attempt would inevitable lead in reality to later chances being stillborn and others being spawned.

Nevertheless, it  may still be a fruitful and illuminating task to assign each actual attempt a likelihood of it resulting in a score, once factors such as pitch position for the shot, if it was with the boot or the head and if, as was the case for Palace's goal, if it came via a counter attack (or aimless punt down field as it was know when the tactic was extensively used by Pulis' Stoke) are accounted for.


Most Likely Scorelines Given the Quality and Quantity of Palace and Stoke City's Goal Attempts.

Shot Generated Scoreline.
(Stoke Score Appears First).
% Frequency.
1-0 25.2
0-0 16.2
2-0 15.5
1-1 11.7
2-1 7.3
0-1 6.7
3-0 6.2
3-1 2.7
1-2 2.1
0-2 1.4
2-2 1.3
4-0 1.3
4-1 0.6
3-2 0.5
1-3 0.3
5-0 0.1
2-3 0.1
4-2 0.1
5-1 0.1
0-3 0.1
3-3 0
5-2 0
0-4 0
4-3 0
2-4 0
6-0 0

* the more unlikely outcomes occurred with such infrequency that they fail to register to one decimal place.

Just over half of Stoke's attempts came inside the box compared to just less than half for their visitors. So initially, even with such a rudimentary classification of attempts, the home side grabs a slight advantage. Better still for Stoke three of their eight penalty area attempts came in an area bounded by two perpendicular lines drawn from each goal post and three others were only marginally outside this lethal shooting area. Once shots from inside the area move towards the lateral extremities of the box, the likelihood of a score begins to fall away. Palace didn't manage one shot from the more profitable central positions.

As a consequence, although numerically equal, Stoke's attempts had a much higher likelihood of a goal resulting from their efforts. The Potters' goal expectancy from their 14 attempts eclipsed that of Palace's 14 efforts by over eight tenths of a goal.

This goal expectancy supremacy, based on the quality of the attempts made by each side on the actual matchday begins to validate the actual one goal margin by which Stoke won the game. But we can go further by simulating the actual outcome of all 28 shots in thousands of possible iterations of Saturday's match. The excitement may be too much for committed Stoke ( ) and Palace (  ) fans to bear!

Over ten thousand iterations, Stoke were by far the most likely winner, judged solely on the quality shot count. They "won" 60% of the simulations, drew 29% and only lost 11% of the time. The five most likely match outcomes all saw Stoke avoiding defeat and the game's actual scoreline was the fifth most likely simulation scoreline, occurring just over 7% of the time. City fans will hope the 25% chance of such a shootout finishing 1-0 doesn't herald a return to the dark, unappealing days of Stoke's binary past.

Overall, less than sparking entertainment, but a fair result in hindsight and three points for Stoke towards their customary 40 point target.

Sunday, 25 August 2013

Identifying Penalty Taking Talent Is Hard.

In the previous post on penalty takers in the EPL, I looked at the conversion rates of kickers who were considered to be either the best or worst practitioners from the recent past. However, because of the relative scarcity of opportunities, it is not possible to say with the degree of certainty implied by newspaper headlines if a player is really as good or bad a penalty taker as his raw conversion rate appears to indicate.

Intuitively, you would probably prefer Frank Lampard to be stepping up to take a kick that is vital to your side's chances, rather than Jonathon Walters. But despite their apparently polar opposite conversion rates it is still possible that Lampard is a average taker who has been lucky and Walters is equally average, but has in addition been blessed with bad luck and a lack of colleagues willing to take on the kicking duties.

The intricacies of the problem of teasing random chance from skill in infrequently repeated tasked can possibly be appreciated by using a simulation. If we allow ourselves to know the true penalty taking abilities of a group of players with absolute certainty, we can then via a spreadsheet and random number generator ask them to take as many penalties as we wish to see how the true "Franks" perform against the true "Jonathons".

These trials will inevitably still be somewhat artificial, but we will know in advance which players are really the best and by the range of their actual outcomes we may be able to see how easy or difficult it is to spot that talent differential in typically generated conversion statistics.

I've taken 5 outstanding penalty takers, whom I've given a true conversion rate of 89% and 15 lesser takers each with a rate of 75.6% to maintain the typical EPL penalty conversion rate of 79%. A rand() function complicit with their true conversion rate is then used to simulate a series of penalty kicks and the results are analyzed to see, firstly, if there is evidence for the existence of a talent differential in the group as a whole and secondly, can we spot if the five best takers are noticeably better than the rest.

Penalties, unlike other shooting opportunities are rigorous in their repeatability. The distance is always 12 yards, no defenders can intervene until the shot is taken and the keeper also has to observe the same restrictions at every kick (and sometimes they even comply with those restrictions). By comparison to open play shots, where game state, and hence defensive pressure, shot position, keeper readiness and mode of execution to name but a few, can vary greatly. We almost have a laboratory experiment.

The first trial consists of each individual player taking 6 penalties. By looking at the spread of the conversion rates of the group as a whole in comparison to that expected from a group of twenty players, each of whom was a dead eye, average penalty converter, we can give an opinion as to if there is a skill differential within the group.

In around half of the trials there was good evidence that skill exists, the spread of successful conversion rates was greater than that expected from a group of kickers whom shared the same conversion rate. Similarly, the average rate for the best five takers once an appropriate amount of mean regression had been applied was above that of the inferior takers in most cases. So the evidence for a skill differential mostly originating from the better kickers outscoring their inferior colleagues appears apparent.

Shootout Between Five 89% and Fifteen 75.6% Penalty Takers.

Number of Shots Each
per Trial.
Evidence of Skill Differential. Did the Best 5 Have A Superior Conversion Rate
6 ~50% of Trials. Almost Always.
12 ~80% of Trials. Almost Always.
50 ~90+% of Trials. Always.

The trend continues as we increase the number of shots taken by each player. At 12 shots by each of the 20 players, we can find evidence for players having differing conversion talent in around 80% of the trials. However, we can still in some cases, erroneously conclude that the two different groups have near identical average conversion rates because the evidence for a skill differential arises from unusual random patterns appearing within those two distinct groups.

For example, in one particular trial the top two penalty converters in that trial both came from the lesser true talent group. They were followed by two from the best group, but the elite group, over a limited test involving 12 individual kicks also saw one of their number tie for 19th spot.

It is only when we get to 50 kicks, a whole career's worth for the most frequent of takers, that evidence of a talent differential occurs in over 90% of the trials and the elite five, as a group have sufficient opportunity to always beat the rest.

In reality, a true talent differential of 89% compared to 75.6% is likely to be an unrealistically large gap and even at these levels a single less talented kicker can still out convert some of his more talented colleagues on occasion, (even if the group always wins through, overall).

If we shrink the true conversion differential between the best five and the rest down to just one percentage point, even 50 trials only identifies possible evidence for the existence of that real gap between groups around 20% of the time and the frequency with which a lesser kicker can top the twenty also greatly increases.

What penalties gain in uniformity of execution they give up due to rarity, few teams or players get to take more than a handful per season. Penalty taking ability has almost certainly a tighter range than the one used in this contrived simulation, yet it was only possible to speculate that such a talent existed around half the time with these likely inflated differences in trials with typical seasonal numbers.

Prior knowledge of the true conversion rates that had been baked into the simulation, along with which kickers had been so blessed, was also needed to simply separate the two distinct groups. Moving to an individual player level at such low sample sizes in reality and with any degree of certainty would likely prove a near impossible task.

If we want to look at possible talent displayed in conversion rates, we need to look at much more frequent, open play goal attempts, for teams and then perhaps onto individual players. But we then have to look also at the factors that make such attempts a much less structured experiment than a set piece penalty kick.

Next post, maybe.

Monday, 19 August 2013

Walters and Lampard. Two Average Penalty Takers?

Picture the scene. The Liverpool players have ceased disputing the award of the penalty kick as Stoke's Jonathan Walters confidently places the ball on the spot. The Stoke fans are both elated and slightly apprehensive as the striker turns, before choosing power over placement by thumping the ball.....past the dive of Pepe Reina and into the dead centre of the goal.

Walters had opened his Stoke City penalty taking career by successfully converting his first Premiership spot kick at the Hawthorns in a customary easy win against the Baggies. His 100% record was slashed to 50% in the unforgiving way percentages can fluctuate in small sample sizes, when his next penalty kick was saved at Norwich. Success at home to Liverpool bumped his numbers back up to percentage levels that were closer to the league average and further converted attempts at home to first Newcastle and then Wigan finally propelled him to levels where he was above the league average for conversion rates.

Any thoughts that Stoke had an above average penalty taker where quickly dispelled when failure at home to WBA was overshadowed by the Baggies actually managing to win the match as well. A feat worthy of epic poetry for Stoke's long suffering local rivals.

By the time Walters had opened his penalty account in the 2012/13 season, once again against Wigan, he had been above the league average on two occasions, marginally below it thrice and well below it following three other attempts.

There then followed an afternoon of high farce, when the luckless Walters capped scoring two own goals for Chelsea with a missed penalty at the Boothen End. Stoke City fans and Petr Cech alike struggled to stifle a giggle. Even referees were joining in by now and he was required to re-take a successful and vitally important spot kick in the dying days of the season at QPR. However, heroic deeds and abject failures are at their rawest when they are most recent and an 89th minute miss at Anfield yesterday with the home side a single goal to the good was enough for Yahoo Sport to ask if John Walters, success rate 61%, is the worst penalty taker in EPL history.

It will be scant consolation to Walters, especially if he chances to log onto Stoke's Oatcake forum, to find that such Premiership greats as Dwight Yorke (60%) and Ces Fabgregas (60%) have inferior conversion rates and Stewart Downing fares even worse with 40%.

The Stoke player formerly known as Super Jonny Walters kicks the ball against Genoa.
So he isn't the worst....except the response required to such a blunt question can not produce as categorical an answer as the one demanded by the web giant. Walters' talent or as some may passionately argue through painful recent experience, lack of talent, hasn't been given the chance to express itself in a sample consisting of a mere 13 attempts. The fact that Walters has been above the historical average success rate of around 79%, slightly below it and substantially below it, depending on when we viewed his records should make us strongly suspect that, dependent on opportunity, there will be more major fluctuations in the Irish internationals headline conversion rate.


A mere 13 attempts is insufficient to use Walters' success rates in standard statistical tests to see if his record is significantly different from the average return expected from a true 79% penalty taker. We can take a slightly different tack and, either by simulated trials, as in the plot above or through a series of binomial trials, it is possible to estimate how likely it was that Walters recorded 8 successful kicks from 13 attempts occurred if each attempt had the generic 79% chance of being converted.

If we crunch the numbers there is just under a 7% chance that Walters is a perfectly average penalty taker who has just happened to score a below average 8 from 13. Ces Fabregas creeps into Yahoo's worst list with even less 12 yard punts. In recording a slightly inferior 60% conversion rate, he has converted 3 from 5 attempts and this time an average spot taker could record those figures 21% of the time.

So by accounting for the number of attempts players with near identical percentage success rates have been trialed over, we can accumulate extra levels of nuanced information that allows us to come to a better informed conclusion. Percentages alone always hide sample size.

Conversion rates are a perfectly adequate way to illustrate a players actual performance over a period of time, although success/ fail records are better. But they often do not reflect a players true levels of skill. That has to be couched in terms of likelihood and probability.

Seasoned penalty taker, Frank Lampard has a headline conversion rate in the EPL of 42 from 48, for 88%. A dead average kicker has a 5% chance of recording these inflated numbers. So if 20 average penalty kickers were asked to take 48 kicks under EPL conditions, on average you might expect one to record the same figures as Frank has done.

So there's a finite possibility that both Lampard and Walters are average penalty takers, exhibiting unlikely, but not precluded sequences.


Football's most valuable penalty was entrusted to Kevin Phillips in May, playing in the colours of Crystal Palace. Phillips' EPL penalty record of 11 successes from 18 attempts also makes the worst list, if we add back in the success/fail information, an average taker would fall to such conversion rates in around 4% of cases. His increased attempts make him a borderline case for seeing if his record is statistically different from that expected from a 79% converter.....and it isn't. Therefore, you could not statistically claim that Palace were entrusting a penalty in a stalemated playoff final to one of the worst penalty takers in his previous career as a Premiership player.

For Palace fans, this was the outcome.......Watford fans may wish to look away now.

http://www.youtube.com/watch?v=mu7Q_Ahc3UA

Check out James Grayson's site for the best penalty posts on the web here
and for a detailed look at Frank Lampard, including his run of 8 successes from 13 attempts see Differentgame here

Friday, 16 August 2013

Final Third Touches, The Precursors To Goals.

The rarity of scoring events in football is one major factor in maintaining it's universal, worldwide appeal. A typical top flight match will contain, on average slightly more than two and a half goals a game, wherever it takes place. Therefore, the outcome of a contest played over nearly two hours, if the halftime break is included, can contain hundreds of individual events, but it is ultimately decided by just a handful of incidents.

The hope or dread that a game changing goal is about to materialize often creates the tension that is so well known to football supporters, but the rarity of the event makes any predictions we make about the game prone to the random variation that is always present in small sample sizes.

The vagaries of random variation impact on the fortunes of football teams through a variety of ways. Firstly, by factors such as shot conversion rates refusing to co-operate in the short term by exhibiting unsustainably high returns or unrepresentatively below par rewards. Even when samples run to larger sizes and goals scored reflect a side's genuine abilities, they may not be distributed within the individual games to reap the maximum returns for the scorers.

However, even before we begin to wrestle with these questions, we need answer an even more fundamental question of how many goals is a side likely to score. August is the month for prediction and notwithstanding the churning of squads during the transfer window, evaluating future team performance in terms of the number of goals they can expect to score (and concede) merely from past performance is still a worthwhile pursuit.

What is likely to occur in the future often relates to what has happened in the past and goals are no different. However, we are partly hamstrung by their relatively infrequent nature. Goals are the most important match day event, but we really could do with many more examples to occur before we can begin to see repeatable skill overcoming unrepeatable, random noise.


In previous, recent posts I've looked at how to try to use more frequently occurring events, where skill is more prevalent than noise, that are reasonably strongly correlated to the less frequent event we are attempting to project for future games.

Goal scoring is inevitably associated with the final act of putting the ball past the keeper, but much takes place prior to the score. Passing build up, along with off the ball running to free a colleague into space, to name but two. At the risk of appearing simplistic, to score in football, you have to be good at playing football.

Passes are the building blocks of the game, but at an even more basic level, the most visible act of playing football involves a player simply touching the ball. Being in possession or close enough to the ball to get a touch immediately makes the player the focus of attention for his team mates, opponents and the crowd, even though much running off the ball is taking place.

If goals are the least common normal football action, merely touching the ball is by far the most common one.

Although it is an artificially designated area, most of the attacking and goal scoring action is played out in the final third. A team is already in the part of the pitch where most goals are struck from and where the majority of the assists or key passes originate. Therefore, it is an area where possession is more keenly fought for and a side which can accumulate lots of touches in this area is likely to be demonstrating that it can "play football".

Above I've plotted the correlation between total touches made by each side in the final 3rd during the 2011-12 season and the total number of goals they scored, with gifted opponent own goals removed. The relationship is reasonably strong and the direction and causative nature would appear to be sensible. More touches in the final third, which of course includes the opponents penalty area and six yard box is related to enhanced scoring.

Not Quite Building To A Goal, Genoa rack up the Final 3rd Touches against Stoke.
If touches in the final 3rd is a skill, that skill is likely to be to the fore in the observed numbers, where such events occur in excess of 7,000 times over a season for some teams. Additionally, if the displayed skill plays a major role in goal scoring, (maybe not in the final execution, but certainly in the neglected build up), perhaps the strong relationship to scoring, coupled with a bountiful sample size, may provide a more reliable predictor of future goals than from merely looking at past goal scoring records of each side.

How Good Are Final 3rd Touches At Predicting Future Goal Scoring Totals.

Team. Final 3rd Touches 2011/12. Goals Scored in 2011/12. Predicted Goals from Final 3rd Touches. Goals Scored in 2012/13.
Arsenal. 6740 73 68 69
Aston Villa. 4689 37 43 47
Chelsea. 6048 63 60 71
Everton. 5614 47 54 53
Fulham. 4988 43 47 45
Liverpool. 6949 42 70 68
Manchester City. 7428 91 77 64
Manchester United. 7062 87 72 80
Newcastle. 4225 51 38 43
Norwich. 4947 52 46 40
QPR. 4830 41 45 30
Stoke City. 3942 35 34 33
Sunderland. 4538 43 41 39
Swansea. 4709 43 44 47
Tottenham. 6298 65 63 63
WBA. 5356 44 51 50
Wigan. 4713 41 44 45

(Blue figures indicate the prediction generated from final 3rd touches was closer to next year's actual performance).

As ever, I've used the number of goals a team would have expected to score given the relationship between the secondary indicator  (in this case touches in the final third) and goals and the actual number of goals scored. I've then compared the actual number of goals scored during the subsequent season to see if goals scored the previous year or expected goals derived from a much more frequently occurring, strongly correlated minor statistic is the better indicator of future performance. In short does the frequent, hopefully skill dominated secondary stat beat a more noisy, but direct comparison.

In 2011-12 and subsequently in 2012-13, touches overwhelmingly predict future goals scored over a season with less error. In 14 of the 17 surviving sides, touches gave a closer estimate of goals scored in year N+1. On average, touch generated predictions were out by 4.5 goals over the season compared to 8.5 when using actual goal totals.

Liverpool's 7,000 final 3rd passes merited 70 goals in 2011-12, but they managed a well adrift 42 scores from their own efforts, but bounced back with 68 a season later. Both over performing Manchester clubs and Newcastle each fell back to earth in 2012-13, producing seasonal goal totals that tumbled back towards the levels expected from the number of final 3rd touches they recorded during the previous year. Although United still managed to stay ahead of the expected curve. Manchester City, however, really did turn out to be noisy neighbours.

If the experience of 2011-12 and 2012-13 persists and we can better predict how many goals a side will score (and concede by a similar process) and by extension, a side's expected goal difference and ultimately finishing position in future seasons, a player merely touching the ball deep in opposition territory may become (almost) as exciting as a real live goal.

Tuesday, 13 August 2013

Shooting Tendencies For Stoke Under Pulis and QPR Under Hughes.

The sight of huge queues still wending their way towards (Sir) Stanley Matthews Way twenty minutes after kickoff on Saturday was more a product of lousy ticketing arrangements and a failure to open more than two stands to home fans than a fervent desire to witness Mark Hughes bringing football home to the Britannia Stadium. Nevertheless, those lucky enough to be in the ground at kickoff against Genoa were genuinely intrigued to see how Stoke's new Welshman intended to reinstate football at the expense of "hoofball".

The heartfelt cheers that rang out as the Stoke back four spread passes from left to right along the backline, may have been slightly tinged with irony as the process was then repeated in reverse. Possession passing with little end product, as many midtable visitor to the Britannia under the reign of Pulis has discovered, often fails to reap any reward.

A pleasant, sun-drenched and predominately half paced workout did nothing other than reaffirm Hughes' promise to attempt a more pleasing style of play. But elegant, if crab like passing moves against similarly relaxed opponents didn't answer the crucial question.

Can Stoke do it on a wet Wednesday night in the Potteries?

Wilson pauses before passing to a team-mate situated in the same postcode.
Unfairly or not, managers are largely judged on the bottom line of results and Saturday's ultimately soporific 0-0 stalemate will have done little to reassure skeptics that the meagre goal tally, deemed sufficient to avoid the drop under Pulis will be bettered under Hughes' pass friendly approach, where the midfield is given relatively free rein to threaten the opponents final third. With the comfort blanket removed from the defence, the cliche of a solid Stoke rearguard, especially on home turf may become another victim of Pulisball's inevitable fall from favour. Potentially bad news for a side which often flirted with relegation well into April.

Tony Pulis' Stoke City have long confounded the general shooting and chance conversion models with their constant overproduction and above average conversion rates, again, especially at the Britannia. It is only when the extra layer of information is added that the "secret" is revealed. Stoke didn't employ lethal, superhuman finishers, they simply created better, lower volume chances, that could be taken closer to goal. Their occasionally novel delivery methods played to their physical advantages by presenting the ball to the striker, or just as frequently, defender in and around the six yard box.

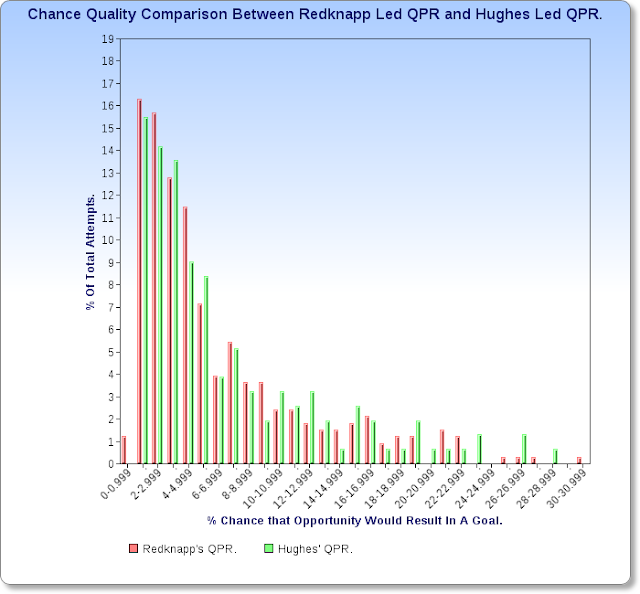
By contrast, Mark Hughes' previous employers, QPR were frequent purchasers of a lottery ticket. While Stoke and the vast majority of QPR's opponents were attempting to craft or bludgeon their way closer to goal, Rangers were content to expend 78 long range, low goal outcome attempts in scoring just once. It is perhaps unfair to attribute all of QPR's optimistic shooting tendencies to Hughes. He merely install the club at the foot of the table, it was left to Harry Redknapp to complete the transition from Premiership to Championship. However, as the plot below appears to illustrate, very little changed with the changing managerial identity.


Dicing the sample causes a few minor peaks and troughs to appear, but essentially the fondness for lots of low quality shots so characteristic of QPR's last season in the top flight appears to have been a tactical characteristic that was approved by both Hughes and Redknapp.

By contrast and in particular when viewed alongside QPR's overall shots allowed and attempted profile here,
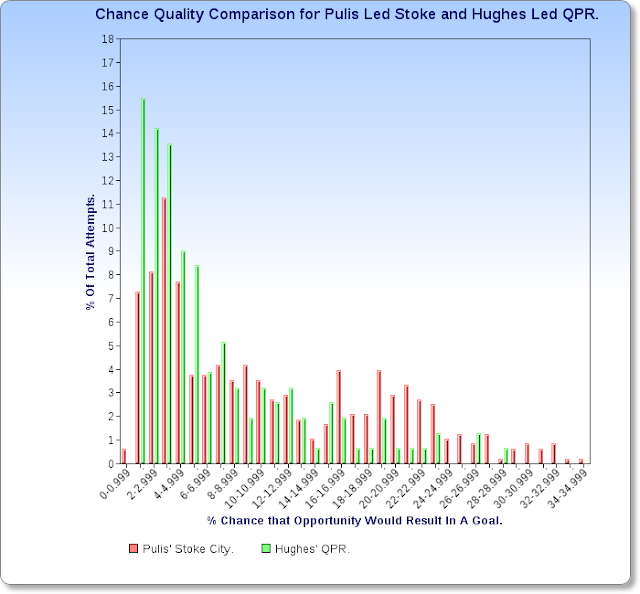
a Stoke led by Tony Pulis actively drove their opponents to attempt QPR-like longshots, while keeping the quality chances for themselves.


The frequency with which Stoke's opponents felt compelled to shoot from distance in the final season of full-bloodied Pulisball stands out starkly in the left hand side of the plot. The Potters then inexorably out created their opponents in the richer areas of the penalty area, where the generic chance of a goal reached out to 16% and beyond. The Stoke fans could comfortably encourage their opponents to shot often from distance, safe in the knowledge that Lowton's late season screamer for Aston Villa in 2012/13 was the exception rather than the rule.


Inevitably, the comparisons between the approach of Stoke's current and previous manager has centred around the difference in passing styles. Although, so extreme was Pulis' adherence to the longball both in an attacking way and also as a way of relieving defensive pressure, that virtually any replacement would have appeared to be a move towards more Barca-like values.

However, as the final plot illustrates, a much more fundamental difference exists between the records of each man. With a similar calibre of side, Hughes persevered, unsuccessfully with low goal probability, long-range shots. Over half of the attempts made by QPR under his half season, relegation reign had a less than 5% chance of producing a goal.

By contrast, the much maligned Pulis in his gloriously annoying pomp offered up to the fans over 30% of their side's chances with a 15% or greater chance of scoring attached. All done with an eye still firmly fixed on goal prevention at the other end.

Sacrificing defensive stability for more frequent, lower quality chances and slightly more goals, may result in Stoke gaining promotion under Pulis and slipping back into the Championship under his more illustrious countryman. Superficially, Stoke appear to be joining the mainstream, but they may simply be trialing another, possibly less successful, if more visually appealing, niche market, where long balls are replaced by long shots.

Monday, 12 August 2013

Using Final 3rd Passes to Predict Future Assists.

In this guest post  I look at how successful final 3rd passes made by individual players appear to be a better indicator of the frequency and number of assists you should expect that player to create in the following season.

It is tempting to use assists in year N as the best indication of assists in year N+1, you are after all comparing like with like. However, successful passes completed in the demanding final third of the field require a player to demonstrate similar skills to those needed to create chances. Players who create chances that are numerically well in excess of the numbers expected from their record of successfully finding a colleague in the final third, invariably see their chance creating prowess recede the following season. Their impressive previous record was most likely down to skill and good luck and the latter often returns to more usual levels in the future.

Towards A Better With or Without You.

In the previous post, I looked at the the growing trend to attempt to evaluate the impact of a single player by referring to game results when he takes part in a match or is wholly absent either through injury,non selection or suspension. Superficially the methodology appears sound, if rather crude. However, on closer inspection the pitfalls are both numerous and largely insurmountable.

By taking such an approach we trying to demonstrate how good a single player is by comparing the difference in team performance in games where he is absent, but replaced by another (not necessarily the same) player, who may play against widely diverse opponents, surrounded by a similar, but often varied collection of colleagues. And the difference is measured in that rarest of footballing commodities, namely goals. Often the exercise runs over a single season, a period that is often even insufficiently large to accurately demonstrate the existence of such universals as the home field advantage enjoyed by a side.

The twin terrors of opponent strength and small sample size can be illustrated with a contrived, extreme example. Often universal problems that occur to varying degrees in reality can be highlighted by use of the unlikely, but possible scenario.

A side wins the league in a canter, winning every match, bar one where an early red card led to a narrow defeat. For the final match, the ever present star is rested to the stands and watches as his team is the early beneficiary of a red card decision and run out easy 6-0 winners.

A raw with/without percentage comparison will give his side a better win or success rate or goal difference in that final game compared to the previous 37 matches when he was a confirmed starter. A yardstick derived from one match is (hopefully) obviously inadequate, but similar problems arise when drawing conclusions even from 10 or 15 game samples.

The fundamental idea is fine, but the current application of the method is awash with noise, leading to little worthwhile conclusions.

Spurious, title related, pop image.
To demonstrate how this approach may be improved it may pay to look to the NFL, where parity is slightly more keenly experienced than in the EPL and player contribution to useful, game defining events is more readily apparent because of the play by play nature of the contest.

An NFL offense takes part in around 60 individual plays per game over the 16 match regular season. None of the 11 players on the field during each play is a passive spectator, as can sometimes be the case in football. Every NFL player has a designated contribution to make on a single play, even if it is merely diversionary and takes place far from the area target by the ball. Furthermore, the success of each play can be quantified, most readily, if slightly unsatisfactory, in terms of raw yardage gained or lost or alternatively, in terms of first downs achieved.

So by looking at the NFL, the concerns around quality of opposition and small sample size is partly addressed. Further, by looking at unique lineups, rather than plays that took place with or without certain players, we can avoid the problem whereby the remaining 10 players may also change identity. And finally if we use the least used lineups to compare against the most used lineup, we can begin to see the likely ranges of the difference in performance at a team level. This may give a ball park figure, when scaled down to individual player levels, of the kind of differences we are (naively) attempting to quantify in a sport with similar levels of professionalism, such as soccer.

More frequent use of the same 11 players on offensive plays, appears to be quality driven. The less man games a side lost to injury the more they use the same players on a single play and on average the more successful they were measured against their recent achievements. So it is not too big a leap to suggest that unique formations that occurred most are likely to represent the near cream of a side's playing staff that year and much less used combinations are more likely to contain lesser players. Visually this also appears to be the case.

Average Performances of Most and Least Used Lineups in the NFL.

Offensive Lineup. % of Total Plays Involving Lineup. % of  Total Yards Gained. % of First Downs Gained.
Most Used. 6.3 7.0 6.9
Least Used. 10.8 9.7 10.0

(Most Used lineups took part in 2100 plays, the least were used in 3800 plays over the 2012 season).

Above I've averaged the outcomes of plays made by the least and most used lineups for every NFL team last season. Success has been quantified both in yardage and first down terms and the percentage of plays each composite unit was involved in is included to give context to the opportunities given to each group.

Fuller context is missing, but the broad picture hopefully matches reality. The most used, presumably more star studded offensive lineups produce slightly more of a side's overall yardage and first downs than their share of the plays would suggest. The least used lineups took 3800 snaps or 10.8% of the total experienced by NFL offenses in 2012 and produced slightly below that % of first downs or raw yardage. 

Arguably, a single season of matches for every NFL side, using nearly 6,000 individually quantified on field plays has managed to show a (small) difference in performance levels between what may generally be described as the generic "best" 11 man lineup and the less favoured ones.

In hindsight, attempting the same for individual soccer players, from individual teams, using just 38 total trials, decided by rare events, should possibly be considered a tad optimistic. The quality of players in the EPL is undoubtedly high, but the difference in quality between interchangeable colleagues in the same side is likely to be very small. Expecting this difference to show itself in match results over a relatively limited timescale, especially with the attendant, unaddressed baggage, is unrealistic.

At the very least we should be looking at using more frequently seen individual or team events, such as successful passes or chances created rather than placing so much faith in match outcomes and accept that we are trying to measure differences that, in individuals, at least is very likely to be swamped by noise. 

Friday, 9 August 2013

A Decade of Steven Gerrard As A Liverpool Mainstay/Liability.

Much of the current internet football discussion revolves around the transfer window and the destination of big name players to pastures new. Understandably, speculation about the likely impact of a newly acquired player on the fortunes of his new  employers is rife. However, it is also entertaining to ponder about the size of the hole the departing player will leave at his former club and how reliant they were on his talents.

The most common approach uses the seemingly simple, yet powerful tool of examining the record of a side when the player was in the lineup to those matches where he was absent. Various twists on the original format are usually used and team match performance is judged either through a combination of goals scored and allowed, points accrued or a weighting of wins, losses and defeats.

A player who helps his team to a more impressive win, loss, draw record is the obvious candidate to be the causative agent for that improved record. The first player identified as a force for providing better results when he was on the pitch compared to those recorded when he was absent was Patrick Vieira in his time at Arsenal. Such was the combative nature of his play, especially when faced with natural championship rivals, such as Manchester United and Roy Keane in particular, that the connection became widely accepted and has often been used for other, high profile players such as Xavi at Barca and latterly Suarez at Liverpool.

A method that uses the relatively rare currency of goals or wins and draws to evaluate a side's performance when one certain individual is either absent or present is fraught with problems. Most obviously, quality of opposition, but also the quality of the remaining 10 or 11 players is largely ignored. Standout players and their colleagues may be rested en masse against inferior opponents or arbitrarily suspended or injured against the best.

However, by far the biggest problem in relying on this kind of with/without analysis revolves around sample size. Small game samples, especially when success or failure is decided by rare events, such as goals often lead to headline grabbing figures, usually expressed in percentages that appear to compare like with like when they do no such thing.

To use the example of Steven Gerrard, a formidable one club man with Liverpool. If we look at the season on season record of his team Liverpool when Gerrard played a part in the match and when he didn't, we find that in ten of those 15 seasons the "Gerrardless" Reds had a better season long success rate than when he played. In just five seasons was Gerrard, (apparently) a force for improved results.

So to decide if Gerrard is an undroppable icon who more often hurts Liverpool's chances, it may pay to look at the actual numbers rather than the percenatge figures.

In 2007-08, Liverpool's record when Gerrard was on the pitch during a game was 29 wins, 16 draws and 7 losses for a success rate of 0.712 compared to 4,2,1 (0.714) when he wasn't. Liverpool were marginally better without Gerrard, but we are comparing the outcome of 53 games to that from just 7.

To illustrate the potential volatility, one more or less loss added to a Liverpool with Gerrard sees their success rate fall to 70% or rise to 72.5%. The same alteration applied to Liverpool deprived of Gerrard sees the high rise to 83% and the lows fall to 62%. There is little change in the former percentage figures, but much larger swings are possible in the latter, when Stevie G is absent.

High profile players are invariably the target for such type of analysis, so they will invariably play often. So the stick we are using to beat them with or the carrot as a reward will almost always be prone to wild fluctuations as illustrated by the effect of a single altered result in the smaller sample size above. In short, the so called "player absent" yardstick should come complete with massive levels of uncertainty because they are based on very small sample sizes, yet, much like many percentage based player figures used across the web, they never do.

Even if we extend the sample size by taking in multiple years, we can still slice and dice the data to suit any narrative by manipulating the figures thrown out by the smaller sized sample.

Steven Gerrard Is An Essential Player For Liverpool.

Time Period. Success Rate with Gerrard. Success Rate without Gerrard. Were Liverpool "Better" With Steven Gerrard ?
Debut to 2012/13 0.643 0.626 Yes
Debut to 2011/12 0.646 0.627 Yes
Debut to 2010/11 0.650 0.628 Yes
Debut to 2009/10 0.657 0.628 Yes
Debut to 2008/09 0.665 0.634 Yes
Debut to 2007/08 0.653 0.628 Yes
Debut to 2006/07 0.644 0.625 Yes
Debut to 2005/06 0.645 0.624 Yes
Debut to 2004/05 0.625 0.621 Yes
Debut to 2003/04 0.634 0.619 Yes


Steven Gerrard Is A Liability For Liverpool.

Six Season Period. Success Rate with Gerrard. Success Rate without Gerrard. Were Liverpool "Better" With Steven Gerrard ?
2013-2007 0.476 0.626 No
2012-2006 0.500 0.626 No
2011-2005 0.535 0.627 No
2010-2004 0.561 0.628 No
2009-2003 0.582 0.634 No
2008-2002 0.591 0.628 No
2007-2001 0.601 0.625 No
2006-2000 0.627 0.624 Yes
2005-1999 0.625 0.621 Yes

For anyone considering using the currently flawed methodology to bolster a subjective opinion piece, feel free to use either of the two tables above. I've calculated Liverpool's success rate with or without Gerrard over differing, multiple timescales since his debut back in the 1990's. The data has been diced and expanded to cover multiple seasons (to enhance it's credibility). One table can be used to illustrate his importance to Liverpool and the second to show how much better they are without him. 

Seemingly powerful data backing diametrically opposed viewpoints for one of the most consistent, high profile and talented players of his generation. What chance for accurate or even meaningful assessment of lesser lights only partway into their careers when they are put under a similar spotlight using similar methods?

Evaluating player contribution is an obvious interest for many parties, but some current methods have the potential to greatly, and surreptitiously deceive.

Just to be clear, this is about abusing stats, not about Steven Gerrard, who is of course a magnificent player.

Tuesday, 6 August 2013

Predicting The Rare From The Commonplace In Football.

Each sport has an event or series of events that have a disproportionate effect upon the outcome of the match. The ability to create chances in soccer is an obviously vital factor in determining match result. They are the precursors to goals and goals are the ultimate arbiter of the successful, defeated or stalemated in soccer.

The ability to score goals, as Blackpool most recently demonstrated, fulfills only half of requirement to be successful. Defence is also important and the Seasiders 55 goals equaled the tally set by Tottenham, but saw them finish 15 places below Spurs because of their 78 scores conceded. The general case is still fairly strong, the more goals a team scores, then the higher up the league you tend to finish, but for the complete picture, we also have to look at defensive performance as well..

Past performance is often an indicator of future achievement. Managers and players invariably come and go, bringing changing skills and tactical development, but a sizable rump of the previous team often remains and previous performance levels still explain at least part of what we may see in the future.

In the previous post I looked at the balancing act between the limitations of using direct comparisons between significant events and instead gathering more copious amounts of data by moving a stage or two back in the process or incorporating more numerous actions that require similar skills to the perform the key acts that we wish to project. Relatively rare goal scoring may be better predicted by examining the more frequent assists from where they originate and assists themselves may also have a more accurate predictive ancestor.

The ball controlling nature of the NFL makes for a much better testing ground for the use of more numerous, secondary events as better predictors of rare, but important, game changing events. Numbers of possessions is almost always equally shared between sides in the NFL. So the effective use a side makes of that possession is a decisive factor in determining the result.

Turnovers, whereby one offense hands the ball over to the other defense (and hence onto the opposing offense) without scoring are extremely difficult to overcome in a single match. Drives are time consuming and teams can ill afford to pass up scoring opportunities through their own carelessness and hand an "extra" one to an opponent.

Interceptions are the most straightforward of turnovers. The quarterback throws to an intended receiver, but a safety or cornerback, most usually, intervenes and catches the ball instead. Possession lost, often along with the game if the process is repeated and the side ends the match with a negative turnover differential.

Interceptions in the NFL are rarer than goals are in soccer. A typical side picks about 16 errant throws a season or an average of one a game, split between game chasing desperation throws and game changing miscues. But their effect on the game result is often so profound that it is extremely useful to have as accurate an estimation of future performance as is possible.

The tried and trusted route of relying on previous performance to predict future outcome doesn't provide a strong relationship. We've already noted that teams change from year to year, but coupled with the small sample size, interception numbers provide scant clues to future intercepting potential. So can improve the strength of the predictive relationship if we instead look to a precursor to interceptions that require similar skills and, crucially occur in much greater numbers?

A pass thrown presents the opportunity for the receiver to make the play, the ball to fall incomplete, the ball to be successfully intercepted or the defender, by his presence to get close enough to the intended receiver to knock the ball away. The latter, a so called defensed pass is a close relative to the full interception and a side records around 90 such plays a season compared to just 16 for interceptions.

Do Defensed Passes Better Predict Future Interceptions?

NFL Team. Actual Def. Interceptions in 2011. Predicted Def. Interceptions in 2011. Actual Def. Interceptions in 2012.
Arizona. 10 18 22
Atlanta. 19 17 20
Baltimore. 15 22 13
Buffalo. 20 15 12
Carolina. 14 15 11
Chicago. 20 14 24
Cincinnati. 10 16 14
Cleveland. 9 15 17
Dallas. 15 13 7
Denver. 9 13 16
Detroit. 21 16 11
Green Bay. 31 20 18
Houston. 17 20 15
Indinapolis. 8 11 12
Jacksonville. 17 14 12
Kansas City. 20 18 7
Miami. 16 14 10
Minnesota. 8 11 10
New England. 23 14 20
New Orleans. 9 19 15
NY Giants. 20 18 21
NY Jets. 19 15 11
Oakland. 18 18 11
Philadelphia. 15 14 8
Pittsburgh. 11 16 10
San Diego. 17 14 14
San Francisco. 23 21 14
Seattle. 22 17 18
St Louis. 12 14 17
Tampa Bay. 14 13 18
Tennessee. 11 16 19
Washington. 13 16 21

What we lose by no longer comparing like with like, may be compensated for by a substantially larger pool of data that describes an associated skill. The relationship between defensed passes and interceptions is relatively strong and in the expected direction, so they are likely to be the product of similar player talent. Therefore using data from 2006 to 2010, I calculated the number of interceptions each side would have expected to make in 2011 based on their number of defensed passes by their defense.

For example, Seattle's defense claimed 22 interceptions in 2011's regular season, but based on the number of passes they managed to physically touch and disrupt during that season, the league average regression from 2006-2010 suggests that they probably over achieved by around 5 interceptions. A league average team managing Seattle's 105 defensed passes would have more likely just grabbed 17 picks. The full list for each team in 2011 is in the table above. 

The discrepancy between the actual figure and the pass defense predicted figures for 2011 can be explained in two ways. Either sides which differed greatly from the prediction got lucky (in a good or bad way) or they were in reality better or worse than the league average. Or much more likely a combination of the two.

As with all recorded stats the skill component tends to persist across time, but the random luck does not. Sides that persistently under or over-perform may be exhibiting their true deviation from the league average skill levels, but the temptation is to see any variation from the average to be fully resulting from different levels of real talent and disregard random variation as even a partial cause. 

For the purpose of this rudementary trial, we can use a single season to see if the underlying talent needed to intercept a pass is better represented in more numerously defensed passes than in relatively rare real interceptions. If there is more signal than noise in an average of 90 defensed passes than there is in 16 interceptions, this should show up in how well each set of 2011 figures predict figures for 2012 for each team. 

Formally, neither actual nor predicted 2011 interceptions are strongly related to defensive interception performance in 2012. Team churn and rarity of the event almost guarantees that. However, the amount of interceptions predicted from passes defensed in 2011 is closer to the actual 2012 figure in 22 of the 32 cases. One honourable tie leaves previous actual performance the better indicator of year N+1 interception performance on just nine occasions. 

If you wanted to predict interceptions in 2012 by looking at interceptions in 2011, you were not looking in the best place.

A couple of new signings can partially change a side's likely stats.
The important events in a sport are often just special cases of a more general talent. A player who can pass accurately in the final third in the Eredivisie, will as likely also be able to provide a key pass that creates a chance for a colleague. Therefore, final third passing ability because of it's relative frequency may well be a much better indicator of a player's ability to create chances than the limited occasions on which he has actually done so over previous seasons.

Correlations will never approach the levels of certainty to which visual evidence often tricks us into believing is possible, but exposing noise among the signal and vice versa is always a satisfying advancement of the raw, often deceptive figures.