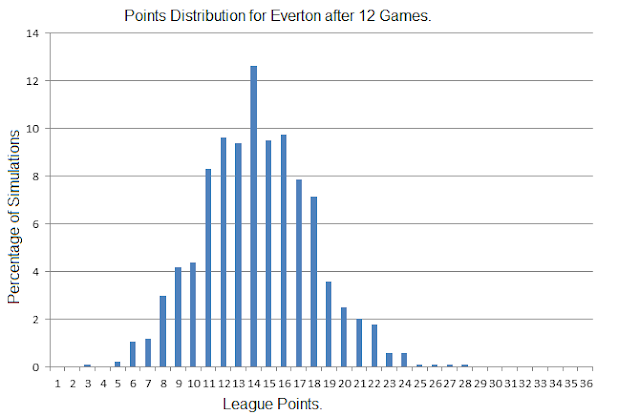
Each of those games has been decided by a variety of significant events, most notably goal attempts that have require the keeper to attempt a save. And while some have resulted in scores others have been saved. The outcomes are not set in stone, on another day, goals may have been saves and saves a cause for wild celebration.
Replaying these goal bound attempts, mindful of how likely such an attempt is to result in a goal based on such variables as location and shot type can convey the variation in the range of possible outcomes and ultimately match results.
In one particular parallel universe, Everton top the table, while in quite a few others Chelsea occupy 20th and bottom position.
The plots below give an idea of the distribution of points a side might have won if the league schedule to date was tipped into a probabilistic soup of shot base simulations.
The remaining teams will follow later, along with similar plots charting the range of current possible league positions after 12 matches.
Actual Table.


Hello - I'd love to know more about your expected goals methodology. Could you point me to a link please?
ReplyDeleteAlso, does your model have any predictive capacity. for instance, if I were to ask you:
"in next week's West Brom vs arsenal fixture"| what are your expected goals predictions for both teams?"
Can you do that? Or is it all ex post analysis?
Hi Albert,
DeleteThe expected goals model takes a variety of inputs, notably, but not exclusively, where on the pitch the attempt was taken from and whether it was a header or a shot.
The relationship between these factors and the actual outcome is found in an out of sample set of attempts and then applied to new data.
So a header from the penalty spot will have a certain goal expectation and a shot from the corner of the six yard box will have another.
Average goal expectation per game for a team does appear to predict future events such as final points total reasonably well.
To come up with a match probability for WBA v Arsenal I would take the average goal expectancy per game that both sides have created for themselves and allowed their opponents to create over the season to date.
Add a percentage of league average to these four values depending upon how many previous matches I am using.
Adjust for WBA being at home.
I get a value of 0.72 for the goal expectation of WBA at home to Arsenal and 1.85 for the Gunners.
Sticking those figures into a Poisson, I get round 14% for a WBA win, 22% for the draw and 64% for an Arsenal win.
Cheers, Mark
Thanks Mark, appreciate the response.
ReplyDeleteWhen you say you would "add a % of league average to these 4 values". Do you mean you would use (for example) 70% Arsenal specific stats and 30% league average?
And what would happen early season when there is no form, or very little? Could you just take the last eg 20 games from the previous season? Speaking of which, when would shots data become too old for your liking ?
thanks again!
hi Albert,
ReplyDeleteyes, weighting league and team specific stats works fine.
After six matches adding around 35% of league average to the actual goal expectation performance of the top teams and about 60% of league average for everyone else and using those figures to predict each sides remaining 32 games gets the RMS Error for final league points down to around 6 or 7 points per team.
I gradually reduce the amount of league average "added" as you get more data from the current season.
Very early in the season, I'd use a weighted average of the performance of the side over the last two seasons, probably around 75% from the previous year and 25% the season before that and then gradually change the weighting as you get more new season data to add in.
I drop previous seasons altogether after about six games.
cheers, Mark