Pages

Wednesday, 15 June 2016

The Premier League Goal Scorers at Euro 2016.

The creme of the footballing elite may play in La Liga or Budgesliga, but there is no shortage of top class Euro 2016 talent who currently grace the Premier League.

18 countries currently engaged at France 2016 have at least one Premier League based squad member, led unsurprisingly by England (23), followed by Wales (13), Belgium and Republic of Ireland, both 12, down to Romania, Iceland, Czech Republic, Slovakia and Sweden with one each.

On the field, the tournament has followed the regular pattern of opening round matches by producing tight, low scoring contests, probably exaggerated by the possibility of knockout qualification for a third place group finish.

It is therefore natural that the focus in the later group stage games will fall on those players who are more likely to deliver goals for their country.

Analysing goal scorers has a series of components. Scorers are successful partly due to their ability to get on the end of lots of chances and then convert these chances with a modicum of skill.

So an ideal goal scorer's output is driven partly by shot volume and partly by shot conversion.

Often the latter is seen as the mark of a natural scorer, the ability to clinically dispatch a chance, even if a player has been largely anonymous in the match. While a player who consistently gets into good scoring positions without success, especially over the short term, is labelled profligate.

In the tables and plots below, I've looked at all Premier League players at Euro 2016 who have scored at least five goals in the last Premier League campaign and I've simulated the outcome of every non penalty goal attempt they made during the 2015/16 season.

This simulated model for each player using such inputs as shot type and shot location produces a distribution of likely outcomes based on the frequency and quality of their chances in 2015/16 paired with the finishing ability of an average Premier League player.


Wales and Arsenal's Aaron Ramsey scored five goals in 2015/16 from nearly 70 attempts. A poor haul from so many attempts, especially when the location is accounted for. Our modelled "average player" only scored fewer than Ramsey's five in 1.8% of simulations and would perform as well or better in a whopping 98.2% of such simulations.


Wonder kid, Marcus Rashford, also bagged five Premier League goals from considerably fewer attempts.

Mr Average would equal or better Rashford's haul in just under 5% of simulations and would fall short of his five goals ~96% of the time.

So if we take these simulation based conclusions at face value we may, selection dependent, have the best and worst Euro 2016 Premier League finishers facing off when Wales play England on Thursday afternoon.

Certainly Rashford has out performed his cumulative expected goals tally by as wide a margin as Ramsey has under performed his.

However, temping though it is to treat "advanced" stats with a degree of certainty, they should still be placed within a larger probabilistic context.

For one, Ramsey has an earlier body of work, where his conversion rates were much better.

Also if we model Ramsey's 2015/16 conversions from the basis of a slightly below average player and Rashford's compared to a slightly above average finisher, then both become less extreme outliers within two closely related classifications,

Expected goals do an excellent job of describing a player's season. Ramsey has been less than clinical, whereas Rashford has been writ large. But as a projection for the future, there is usually a large pull towards the average for the league as a whole.

The English striker is likely a better finisher than the Welsh midfielder, but the gap is unlikely to be as wide as their respective 2015/16 figures imply.


In the remaining tables I've simulated the Premier League attempts of all players at Euro 2016 who scored five or more actual non penalty goals.

Those whose red figures, denoting their actual goal tally, fall above the greened up most likely outcome from the simulation failed to catch the eye as a "clinical" finisher, while those whose red figure falls below green probably did.


The majority of the Euro 2016 player's 2015/16 Premier League achievements are within statistical touching distance of those expected from our "average player".

Kane, Rooney, Long, Benteke, Giroud, Arnautovic and Sterling are each cocooned within a sea of greened up average output.

Which may encourage you to lean towards attempt volume as a more important driver of actual goals than the perceived ability to consistently nutmeg the keeper once you get him in your sights.

Saturday, 11 June 2016

The Goal Keeping Class of 2015/16.

Goalkeepers, along with strikers are the easiest group of players for which to create individual expected goals metrics.

Expected goals models attach a probabilistic estimate of the outcome of every attempt on goal using a variety of variables, notably shot location and type.

Comparing a striker's actual scoring output against the "average player" outcome predicted from the model provides a simple benchmark for over or under performance and the same can also be done from the perspective of the keeper.

Often such results are condensed down to a single figure.

For example, a keeper who allows ten goals, when the cumulative total of the expected goals from all the on target attempts he has faced comes to eleven may be considered to have over performed by allowing 9% fewer goals than an average keeper might have.

While this approach conveys some information, it does lose a lot of the granular nature of the initial shot data.

In addition the distribution of expected goals over a range of shots having widely differing individual goal expectations is not always wholly represented by the cumulative total and sample size is also omitted in the catch all figure.

Running simulations of all the shots faced by a keeper maintains some input for both the quality and the quantity of the dataset.

Liverpool's Simon Mignolet had to deal with 112 attempts ranging from 1 in a 1,000 long shots to 9 out of ten near certainties. The cumulative expected goals total for all chances he faced came to just over 36 goals.

If we simulate every attempt faced by Mignolet using the output from a shot model based on prior seasons, we can see how likely it is an average Premier League keeper would concede 42 goals or worse. This was the record actually achieved by Mignolet in 2015/16.


That value comes to 9%. So, nearly 91% of the average keeper iterations result in fewer than the 42 goals Mignolet actually conceded. Therefore, Klopp's search for another keeper in time for 2016/17 is perhaps understandable.

By contrast, Fraser Forster faced 67 attempts, saving 50 and conceding 17 goals against an expectation of nearly 20. So an above average season long performance.


This can be quantified in a similar manner to Mignolet's under performance. Just as an average keeper would likely perform as bad or worse than Mignolet had in 2015/16 only 9% of the time, such a keeper would only perform as well or better than Forster in 22% of the iterations.

Models cannot capture every aspect of a chance, keepers may mature and decline with age and injury related fitness. But a probabilistic approach such as this can at least demonstrate that Mignolet's season was likely to have been a disappointing one and Forster's above par. Although based on this single season alone, there may be a 22% chance that he was just an average keeper buoyed by luck.


These plots can be summarised in spreadsheet format for all keepers from 2015/16.

The above heat maps illustrate the most likely number of goals conceded by an average keeper for attempts faced by the four keepers, The actual number of goals allowed by each keeper is highlighted in red.

Mignolet's poor season is shown by the small percentage of iterations that fall below his highlighted % figure.

Schmeichel's season was slightly above average, as his highlighted figure lies slightly above the most likely outcome of 40 goals conceded.

However, we perhaps shouldn't be too confident that his slight over performance is entirely down to talent. There is a greater than 30% possibility that an average keeper would achieve a results as good or better than Schmeichel did simply through randomness.

Lloris and Adrian also recorded above average shot stopping qualities, but again not by a large enough margin that we might confidently conclude that they are certainly superior to our average goal keeping benchmark.

The remainder of the keeping achievements from the 2015/16 season are summarised below.

The higher the red actual figure is above the darkest green formatting denoting the performance of an average keeper, the more likely the keeper is to have put in an above average performance.

And the lower a player's actual figure is below the benchmark average, the more likely he is to have exhibited below average levels of talent.

Brad Guzan's numbers were so bad he has broken the system, but as his colleague, Mark Bunn also scrapes the bottom of the barrel, it does seem possible that their car obsessed defence may have contributed levels of incompetence that was largely absent among other Premier League teams.  


Friday, 3 June 2016

Age Profile of All 24 Euro 2016 Countries.

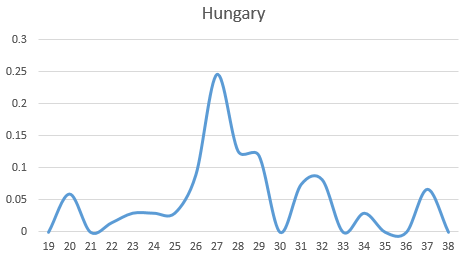
Here's the proportion of playing time seen by age groups for all 23 qualifiers for Euro 2016 over the period of qualification. France, as hosts did not have to qualify, so their profile is simply taken from their final squad.

Peak age for performance may vary between player or position, but it tends to be from the mid to late 20's.

Averages are often used to describe a squad or team, but these are almost always misleading.

A team can have an average age  of say 26 which is made up almost entirely of peak age players aged 26 years or it could have the same average age, but comprise of near equal numbers of players aged 21 and 31.

These distributions can be expressed numerically, but the visualisation of a plot based on proportion of playing time given to each age group probably best illustrates the career cycle of the current crop of internationals.

The team who have access to the biggest proportion of peak aged players at the 2016 finals is Ukraine.