I've chosen the Stoke v Spurs game in the penultimate week of the 2012/13 season, mainly because I took loads of photos at the match, which coincided with Stoke's 150 year celebrations.
Stoke had won just three of their previous 19 games, but two recent victories and a fixture list that threw up Wigan vs Villa on the last weekend, meant that relegation was no longer a threat. Spurs needed the win to keep their hopes alive of overtaking Arsenal for the final Champions League qualifying spot.
The game was played in a constant downpour. Stoke took an early lead through N'Zonzi, Spurs equalised soon after with Dempsey and following a rather predictable Adam red card just after the break, Spurs won the game in the final ten minutes.
Final score 1-2. It was Tony Pulis' final home game as Stoke manager.
Stoke had six goal attempts to Spurs' 25. For simplicity I've ignored related chances from the same attacking move.

The set up is as before. Column "A", the player taking the attempt, "B" his team, "C" the individual goal expectation for the attempt based on your model, "D" a randomly generated number (=rand()), "E" whether the attempt was successful or not.
If the random number is below the goal expectation for the chance, it's a goal. The formula to implement this is shown in the formula box above. Just copy it down for all 31 attempts in the 90 minutes.

Sum the "goals" scored by Stoke. It is the sum of the cells from E2 to E7. For Spurs it is the sum of the cells from E8 to E32.

Now we need to work out the result. Stoke's total goals in the game are in G2 and Spurs' in H2.
If Stoke win G2 must be greater than H2. If that is the case, the formula in I2 returns a "1". If not it returns "0".
For the draw returned in J2, the formula's altered to =IF(G2=H2,1,0). This returns a "1" for a draw or a "0" for a non-draw.
A Spurs win in K2 arises from =IF(H2>G2,1,0)

We're ready to run 1,000 sims of the game. As before drag the number of iterations from 1 to 1000. I've put that in column "H" starting in H4, below the Spurs score.
Then copy the match result into I4 to K4 for each of a Stoke win, a draw or a Spurs win. You put =I2 into cell I4, =J2 into J4 and =K2 into K4.


Again highlight the cells where we want the iterations to appear, in this case K1003 to H4.
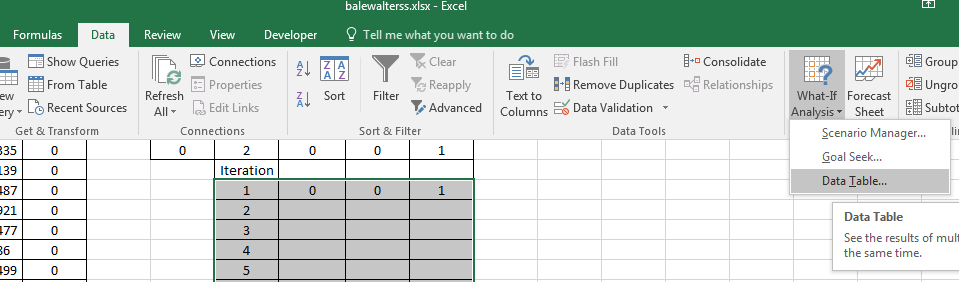
Again click "Data" on the ribbon, followed by "What-If Analysis" and then "Data Table" on the drop down menu.

Once again in the action box, click the cursor into the column input cell rather than the row input cell.

Now click "OK" and the results will fill the three column with Stoke wins and a fair few more Spurs victories. This may take a little longer than the previous two simulations for the individual players.

Once the results have fully populated you can sum for the number of Stoke "wins" based on the balance of their attempts compared to those of Spurs.
 |
| Should be a close game as long as the ref doesn't spoil it. |
In this case 8.6% Stoke wins, 18.6% draws and 72.8% Spurs wins.
Hi Mark! And thanks for reply. in this case i want to ask is it possible to simulate single match if i know team goal expectancy. Example Stoke score 1.3 Spurs 2.1 prematch. Thanks
ReplyDeleteHi Arzu,
ReplyDeletepre match, I'd suggest simply putting the expected goals for each side into a Poisson calculation.
Using your example, you'd get around 23% Stoke win, 55% spurs win and 22% the draw.
Mark
Hi Mark - does your Poisson calculation assume that each sides goal total is independent?
ReplyDeleteThe example I've posted does, but you can tweek the poisson fit to get a better fit with reality.
ReplyDeletecheers, Mark
Hi Mark saw your earlier reply on using a poisson calculation for team goal expectancy. Was wondering where would I start in terms of simulating the games for this? Cheers
ReplyDelete